 View all 2 pages
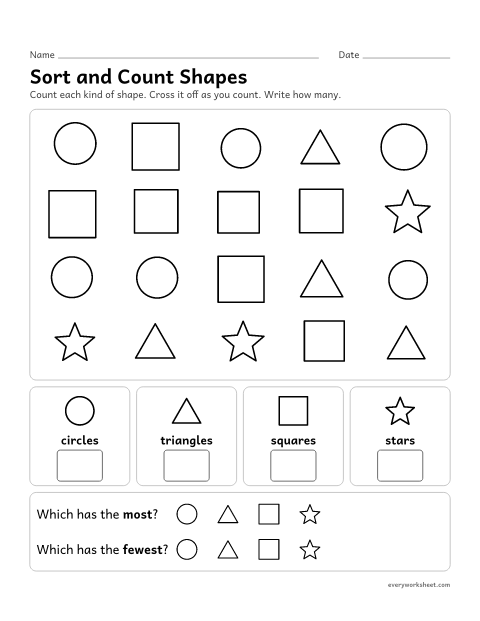
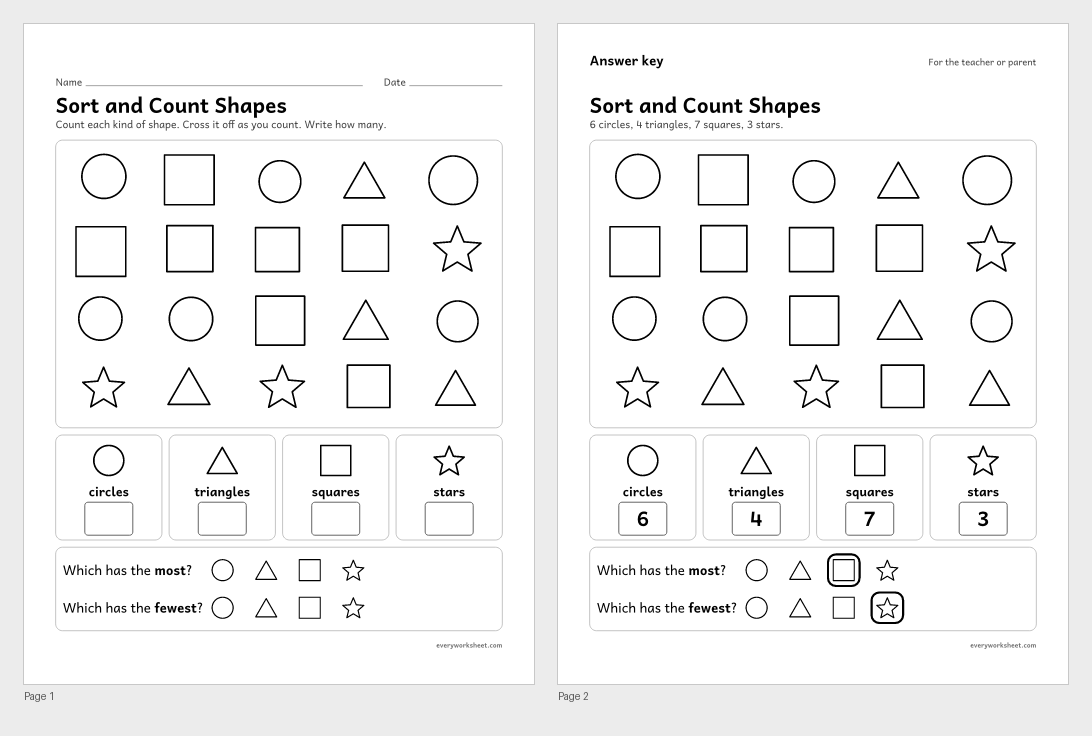
Sort and count shapes
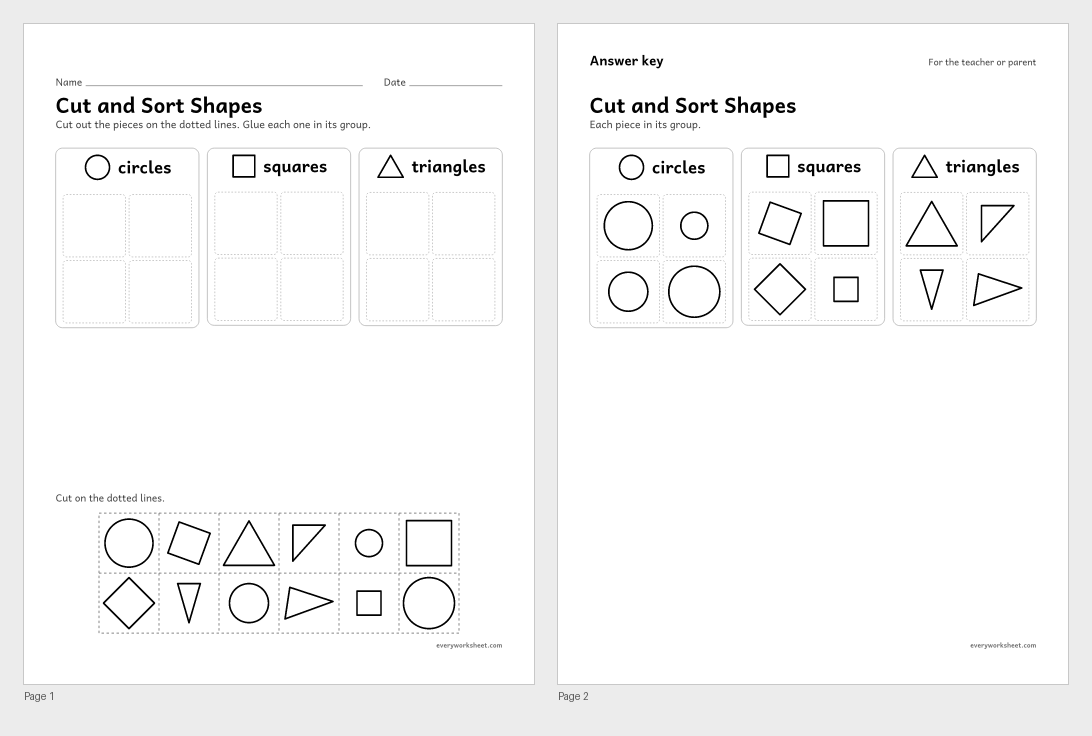
Sorting shapes into groups and counting each group
Answer key on page 2
2 pages48 KB
Sort shapes into groups, count each group, make picture graphs and bar graphs, and read graphs to find most and fewest.
View all 2 pagesSorting shapes into groups and counting each group
Answer key on page 2
2 pages48 KB
 View all 2 pages
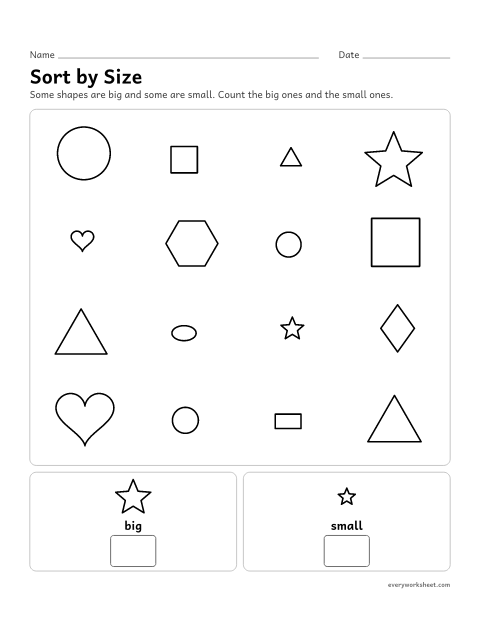
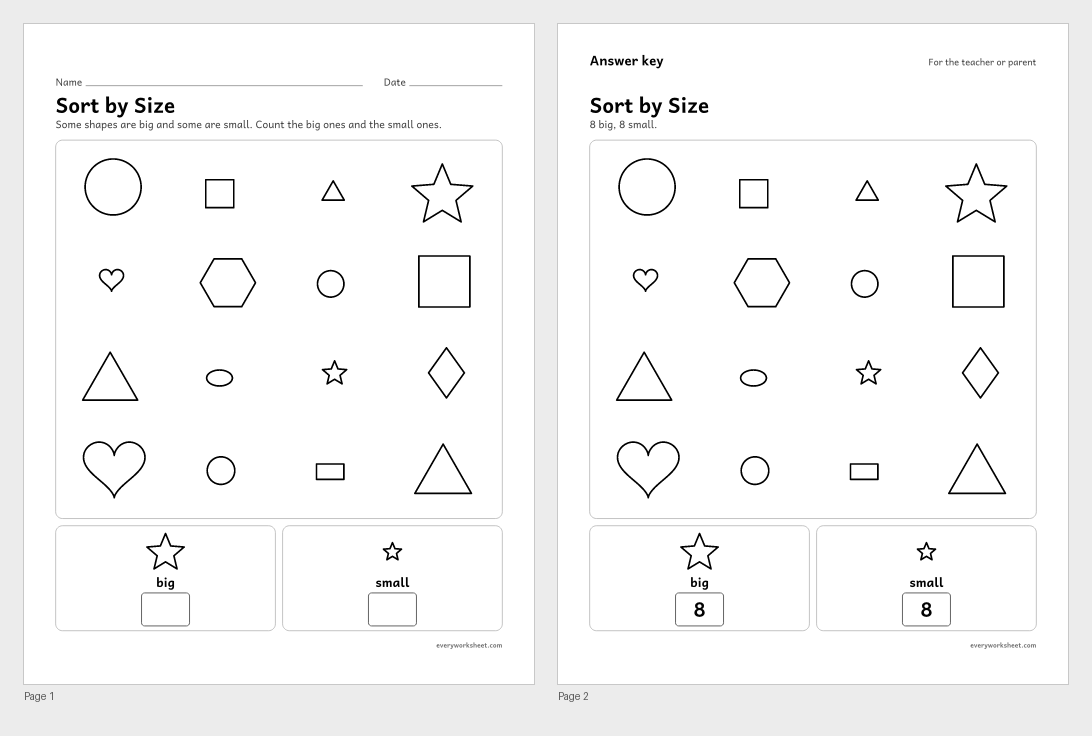
Sorting shapes by size and counting each group
Answer key on page 2
2 pages40 KB
 View all 2 pages
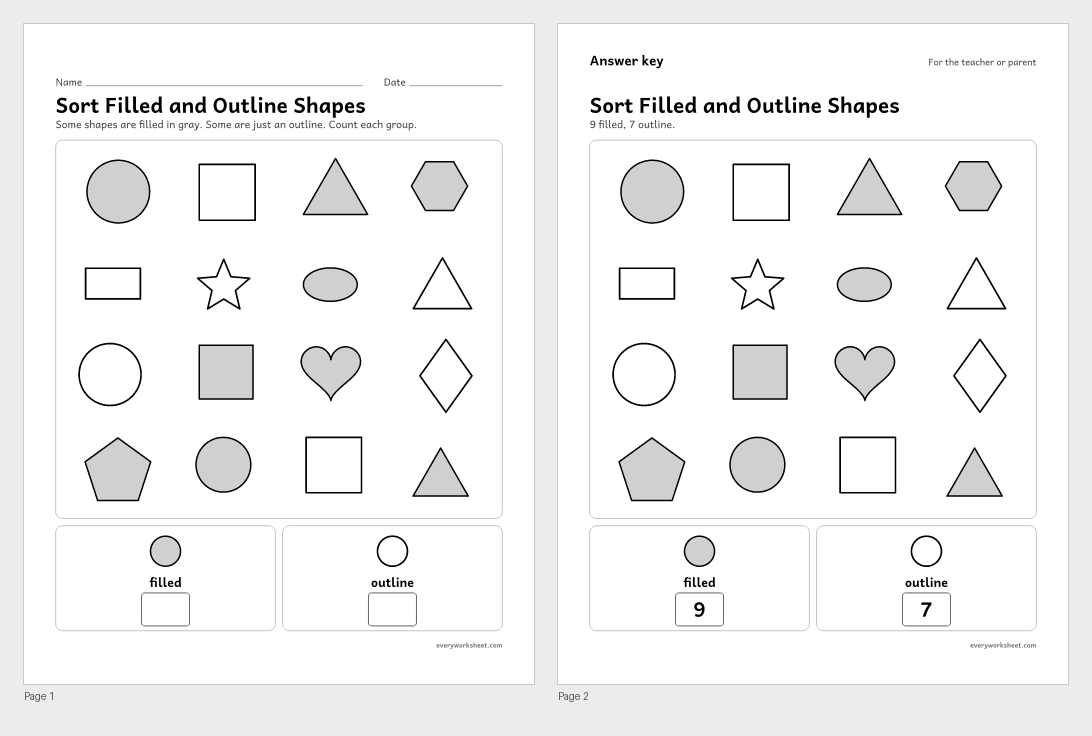
Sorting by a look-alike attribute and counting
Answer key on page 2
2 pages40 KB
 View all 2 pages
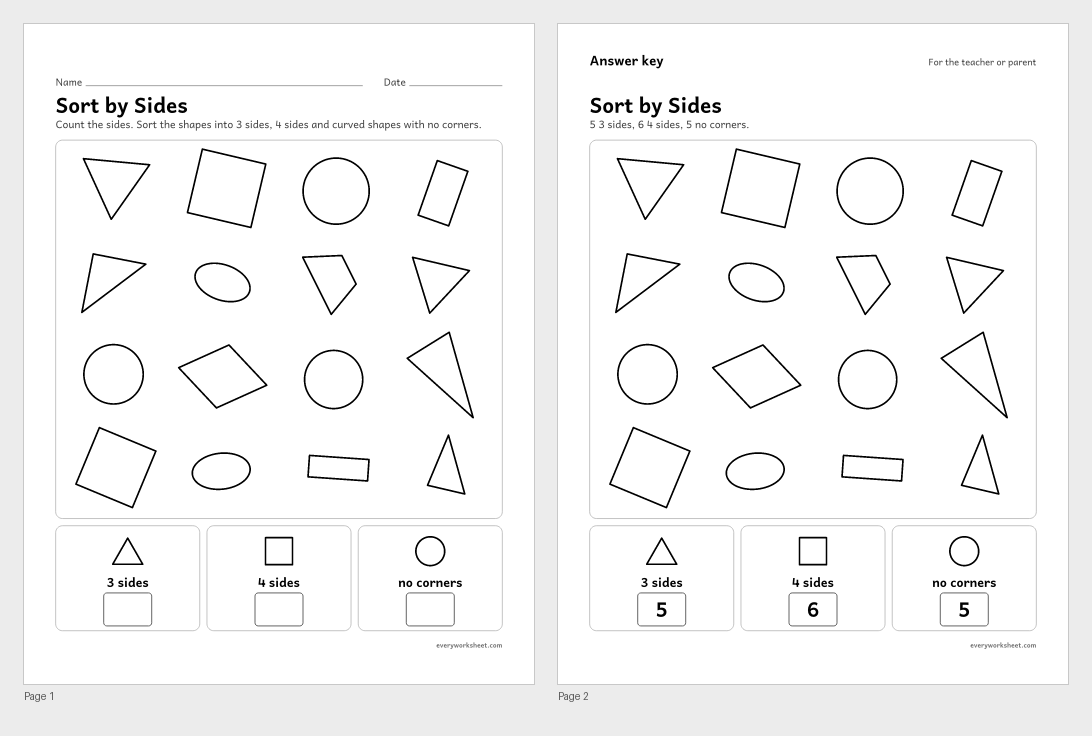
Sorting shapes by number of sides and counting
Answer key on page 2
2 pages43 KB
 View all 2 pages
 View all 2 pages
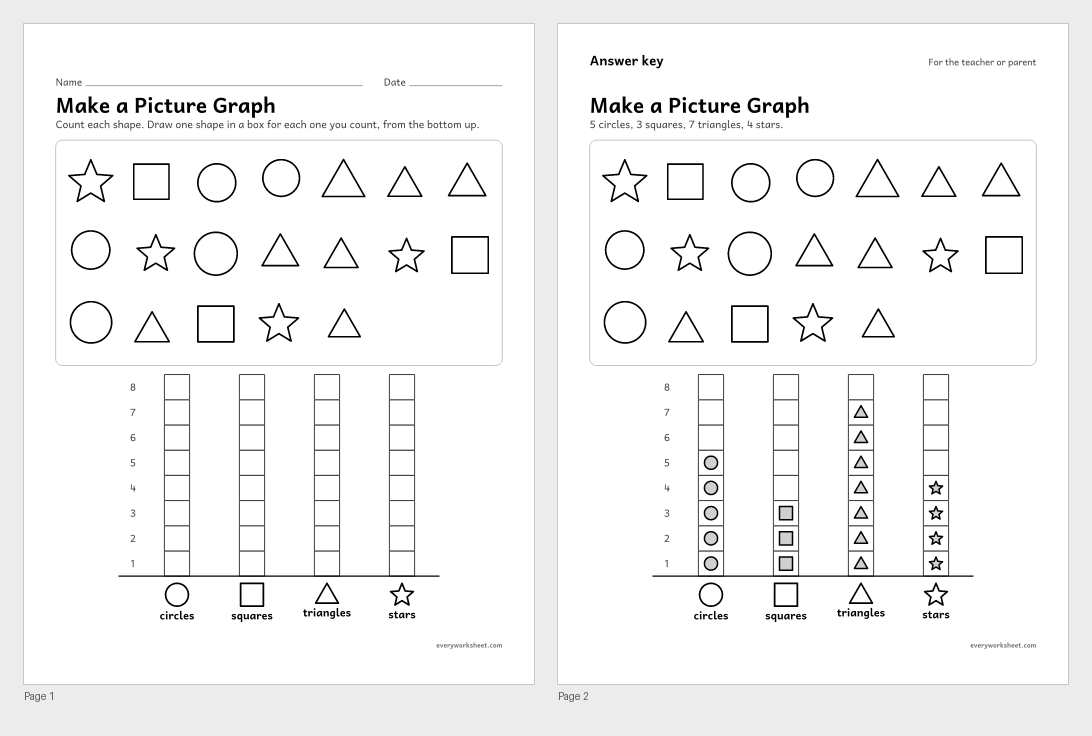
Counting groups and showing them in a picture graph
Answer key on page 2
2 pages40 KB
 View all 2 pages
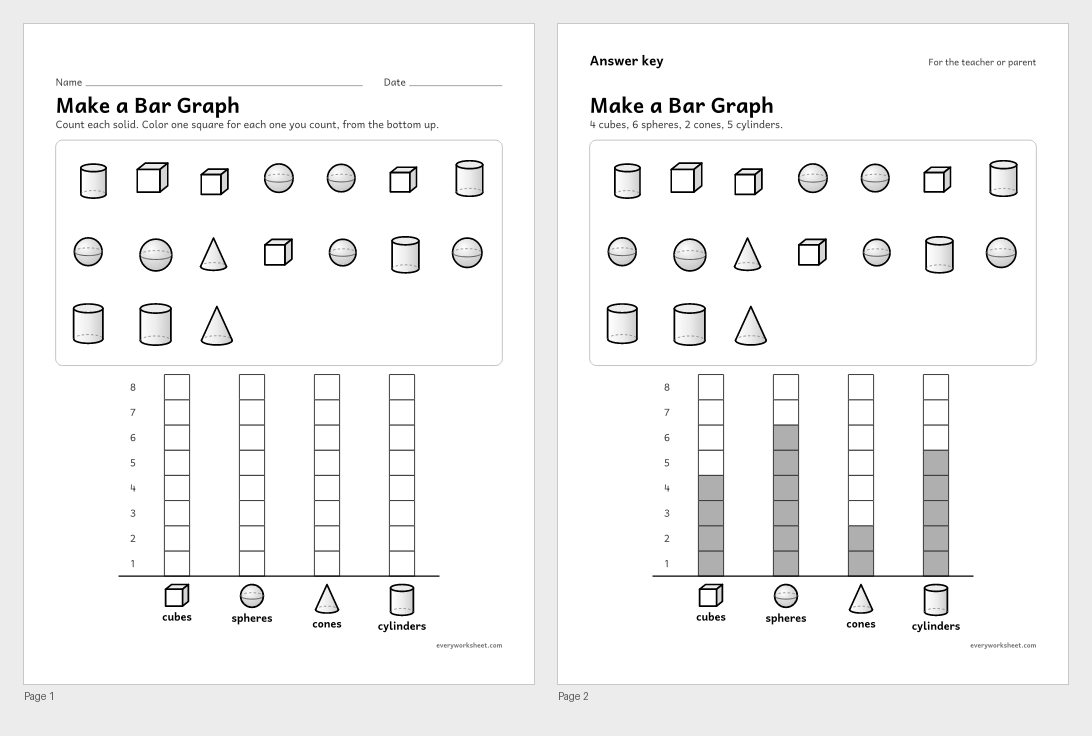
Counting groups and coloring a bar graph
Answer key on page 2
2 pages66 KB
 View all 2 pages
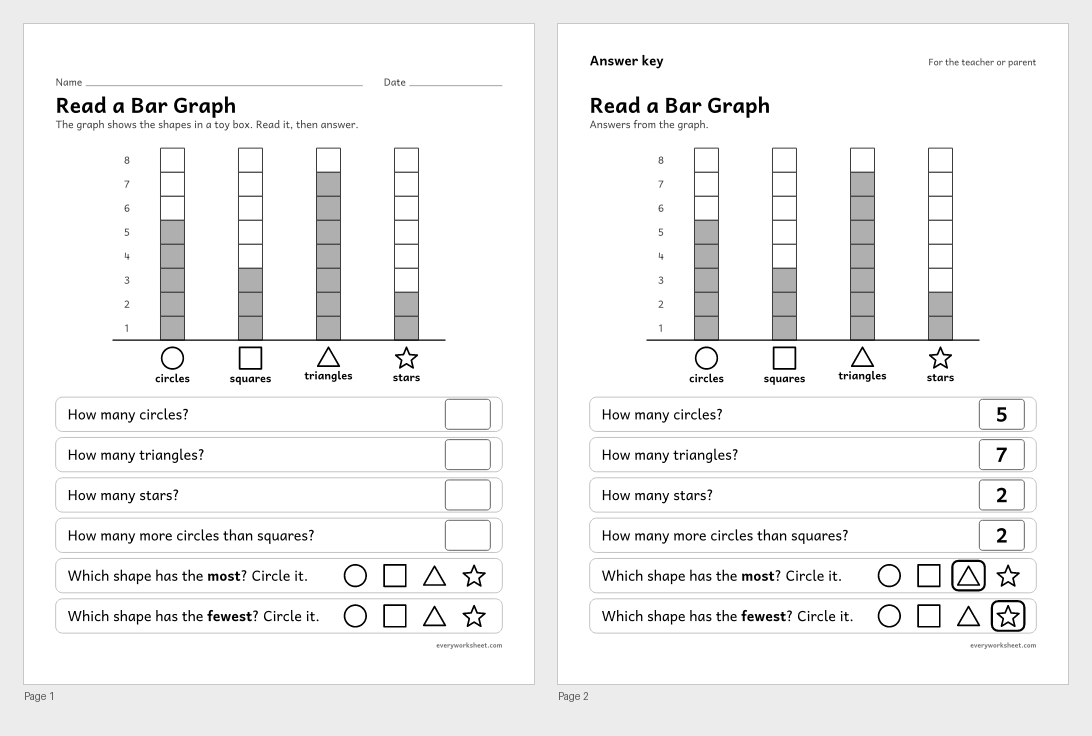
Reading a bar graph: how many, most and fewest
Answer key on page 2
2 pages39 KB
 View all 2 pages
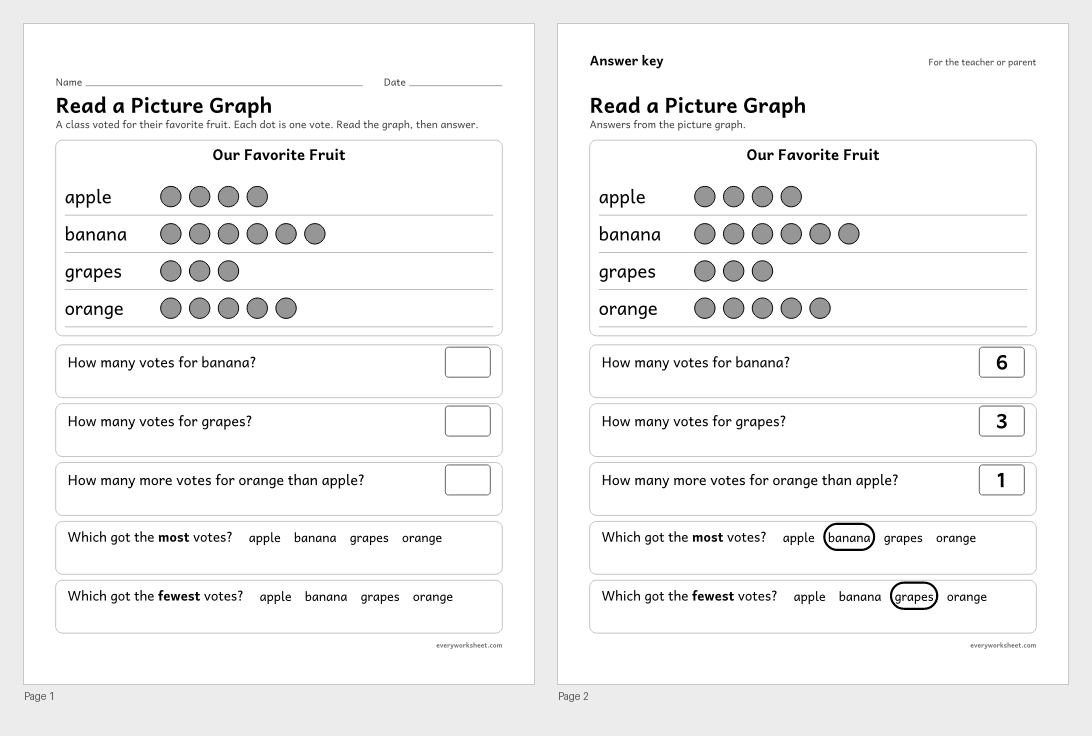
Reading a picture graph: how many, most and fewest
Answer key on page 2
2 pages38 KB
Print at 100% (actual size) for the cleanest tracing lines.
Sorting and graphing go together. First children sort things into groups, like circles, squares and triangles, or big and small. Then they count each group. A graph is simply a picture of those counts, so it is easy to see which group has the most and which has the fewest.
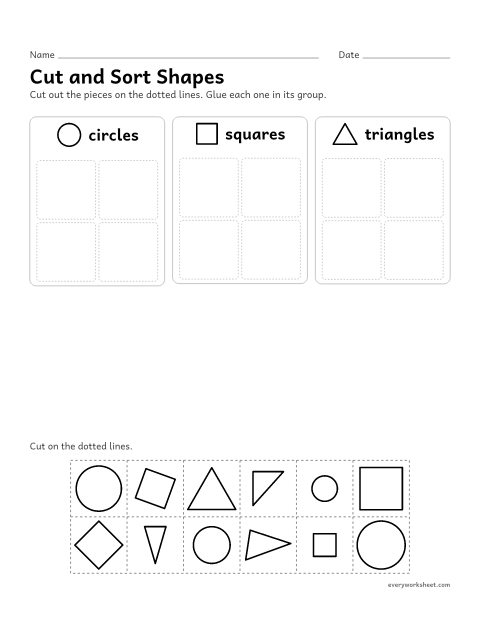
The sorting pages use shapes in black and white, so groups are by shape, size, sides, or filled (gray) and outline instead of color. That keeps every page printable on any printer. There is also a cut-and-sort page for hands-on practice.
The graphing pages move from making to reading. Children count shapes or solids and draw or color one box for each to build a picture graph or bar graph. Then they read a finished bar graph and a picture graph of class votes, answering how many, how many more, and which has the most or fewest. Answer keys are on page 2.
CCSS.MATH.CONTENT.K.MD.B.3Classify objects into given categories; count the numbers of objects in each category and sort the categories by count.CCSS.MATH.CONTENT.K.CC.B.5Count to answer "how many?" questions about as many as 20 things arranged in a line, a rectangular array, or a circle, or as many as 10 things in a scattered configuration; given a number from 1-20, count out that many objects.Kindergartners make and read simple picture graphs and bar graphs. They sort objects into groups, count each group and say which has the most or fewest.
They are made to print on any printer. Instead of color, shapes are sorted by kind, size, number of sides, or filled and outline.
A picture graph uses a small picture or dot for each thing counted. A bar graph colors one box for each thing, making a bar. Both show the same counts.
Yes. Each one has an answer key on page 2 of the PDF.