 View all 2 pages
Read a bar graph
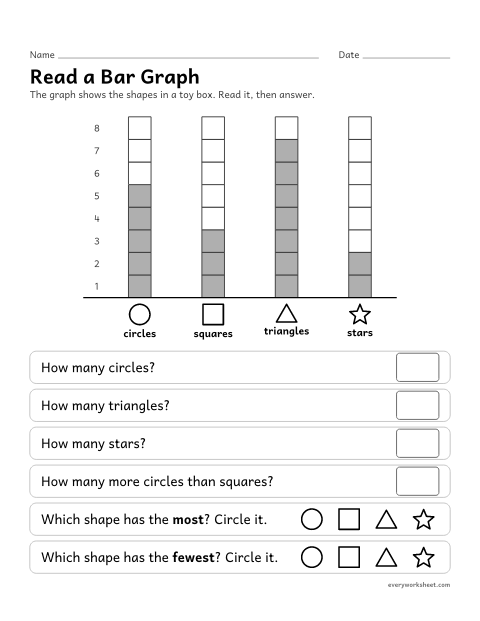
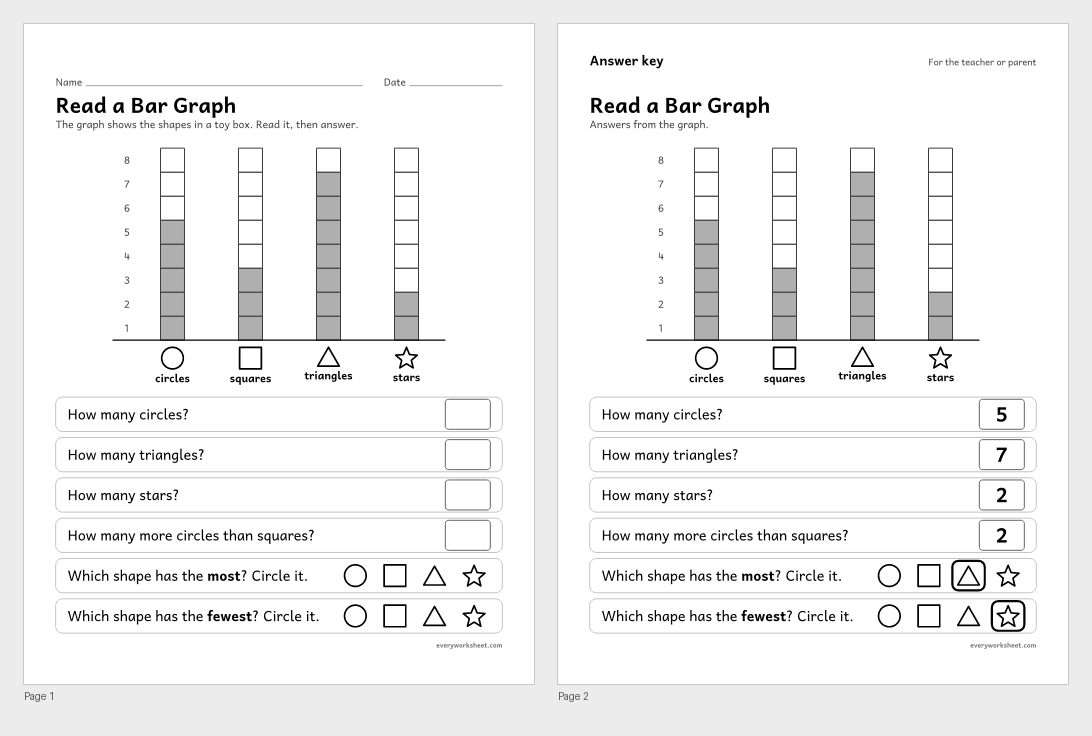
Reading a bar graph: how many, most and fewest
Answer key on page 2
2 pages39 KB
Read and make bar graphs from kindergarten to 3rd grade, with scaled bar graphs, word problems and science data graphs, all with answer keys.
View all 2 pagesReading a bar graph: how many, most and fewest
Answer key on page 2
2 pages39 KB
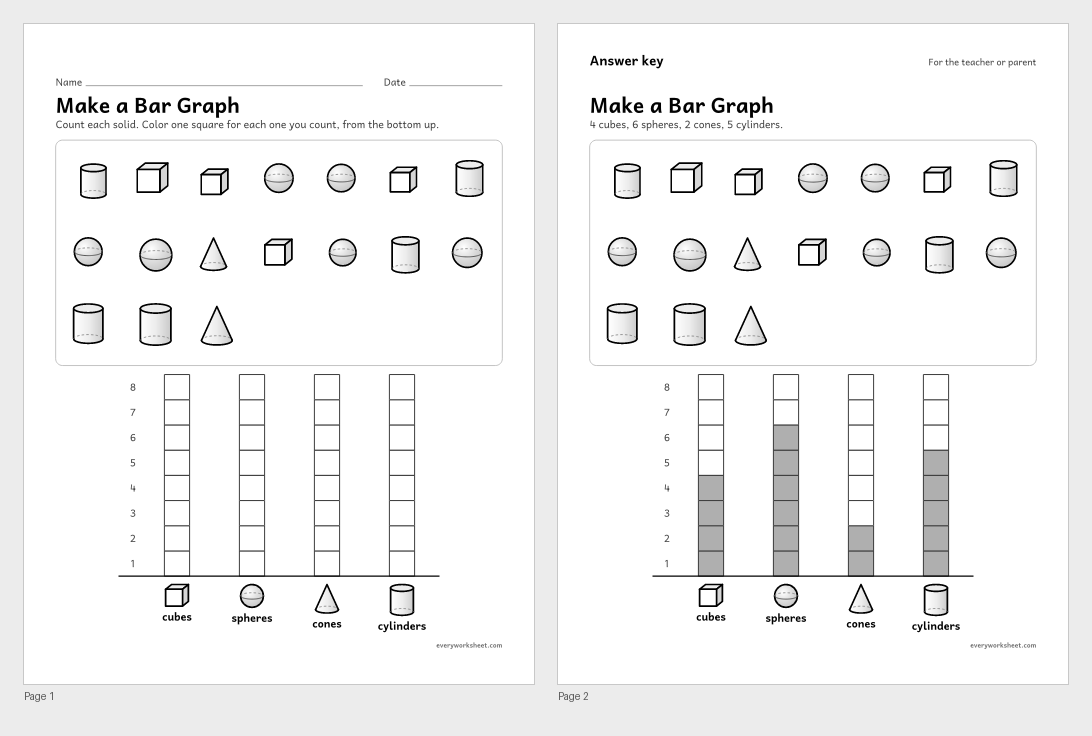 View all 2 pages
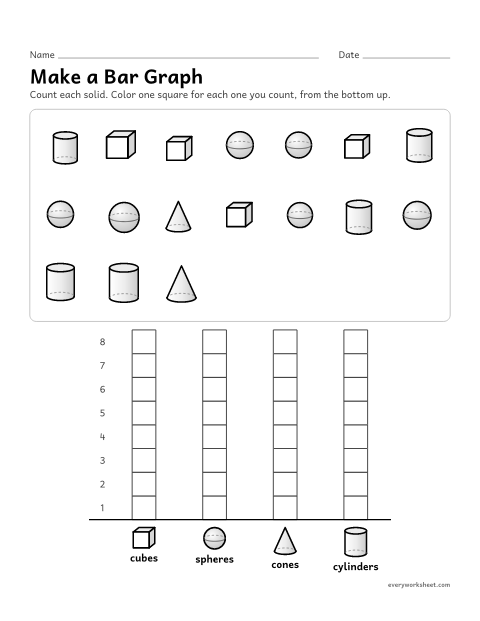
Counting groups and coloring a bar graph
Answer key on page 2
2 pages66 KB
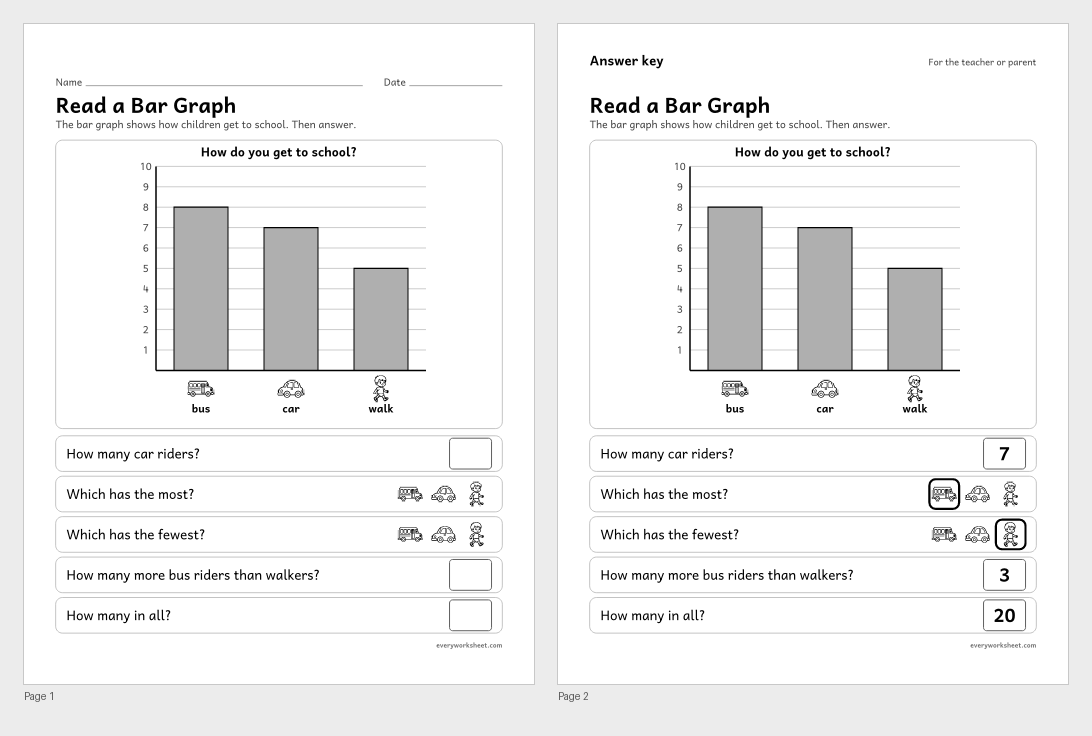 View all 2 pages
Reading a bar graph with three categories
Answer key on page 2
2 pages292 KB
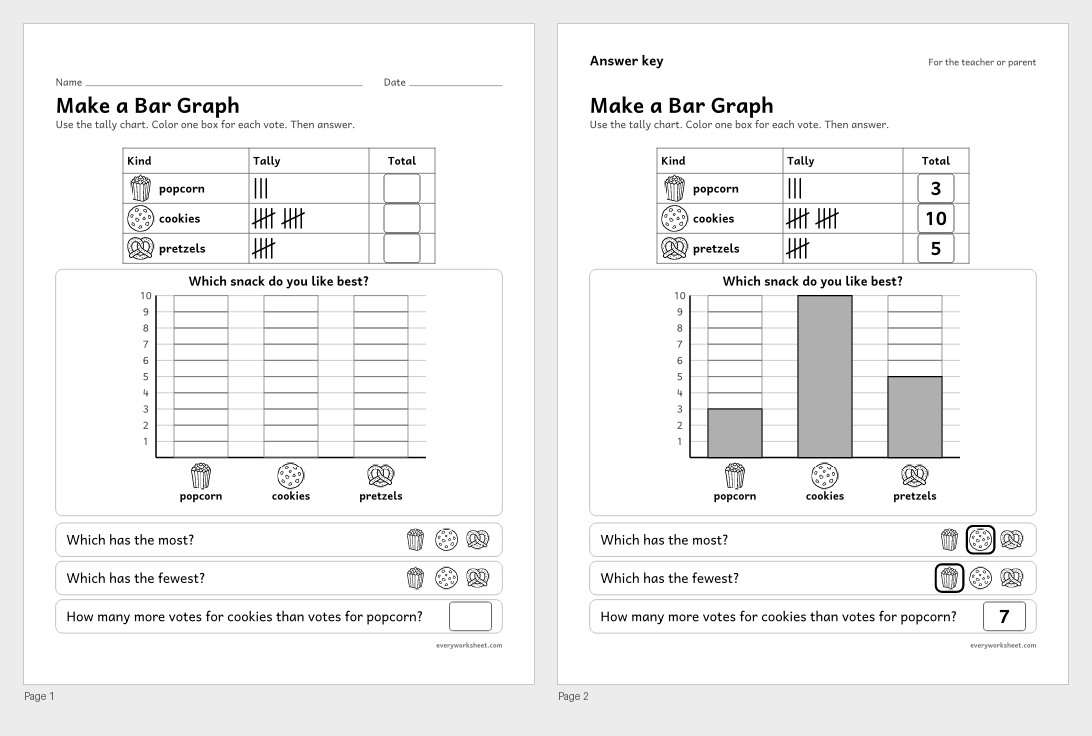 View all 2 pages
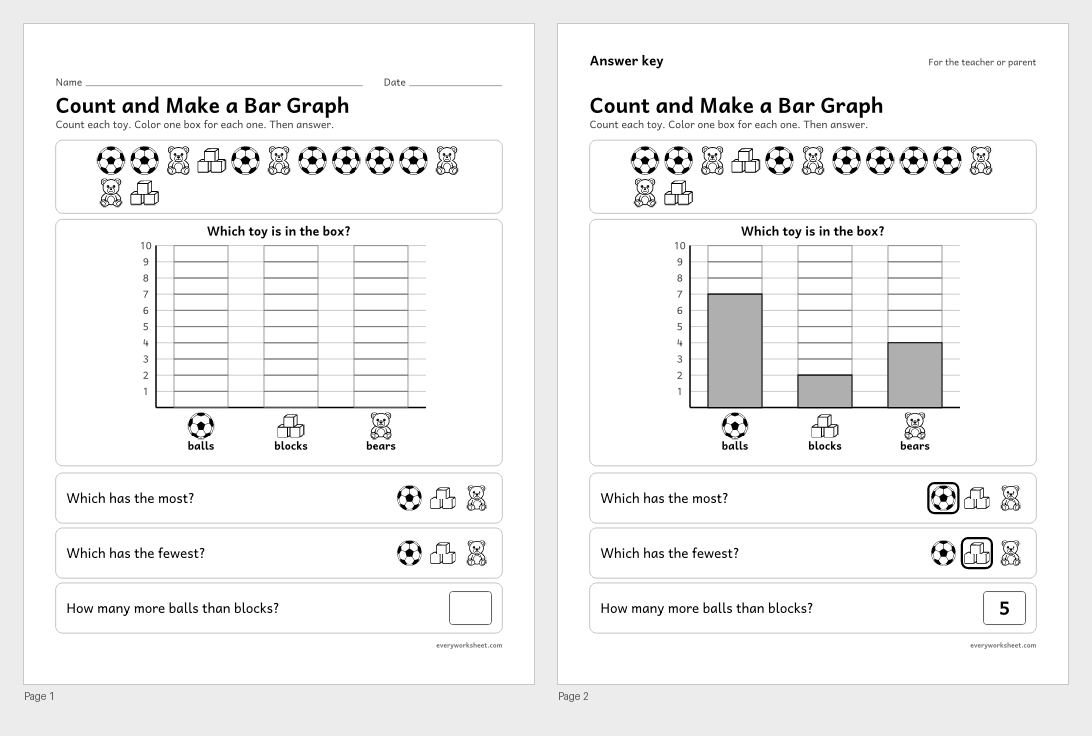 View all 2 pages
Counting pictures and showing them on a bar graph
Answer key on page 2
2 pages327 KB
 View all 2 pages
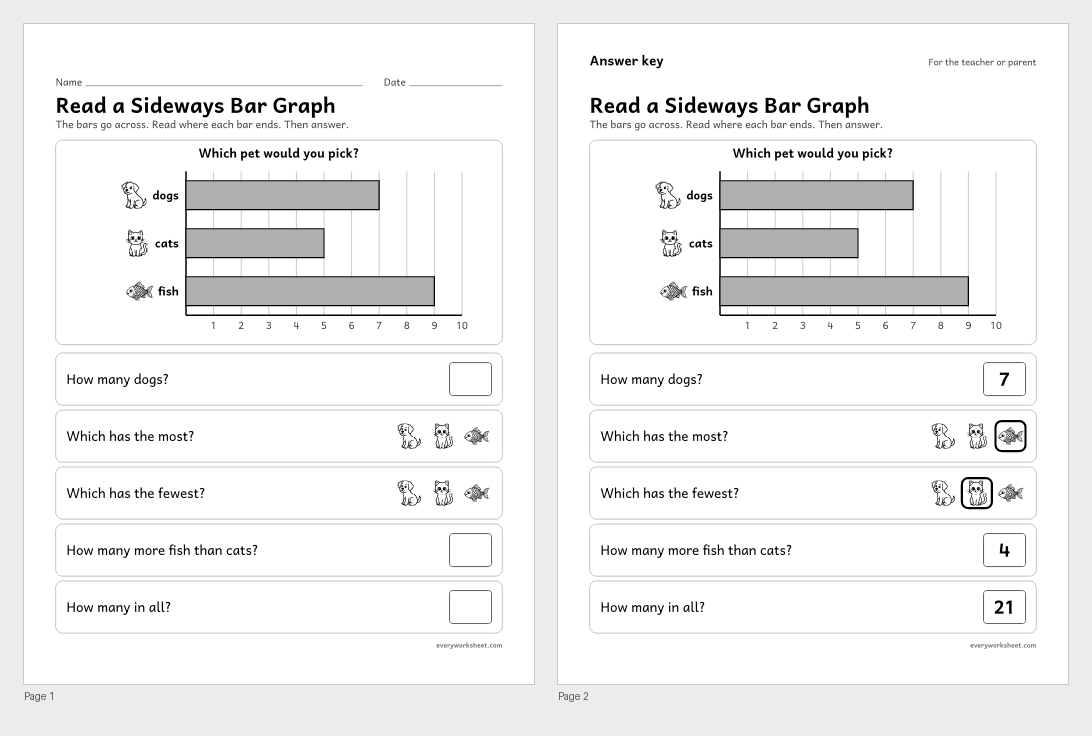
Reading a horizontal bar graph: how many, how many more and how many in all
Answer key on page 2
2 pages365 KB
 View all 2 pages
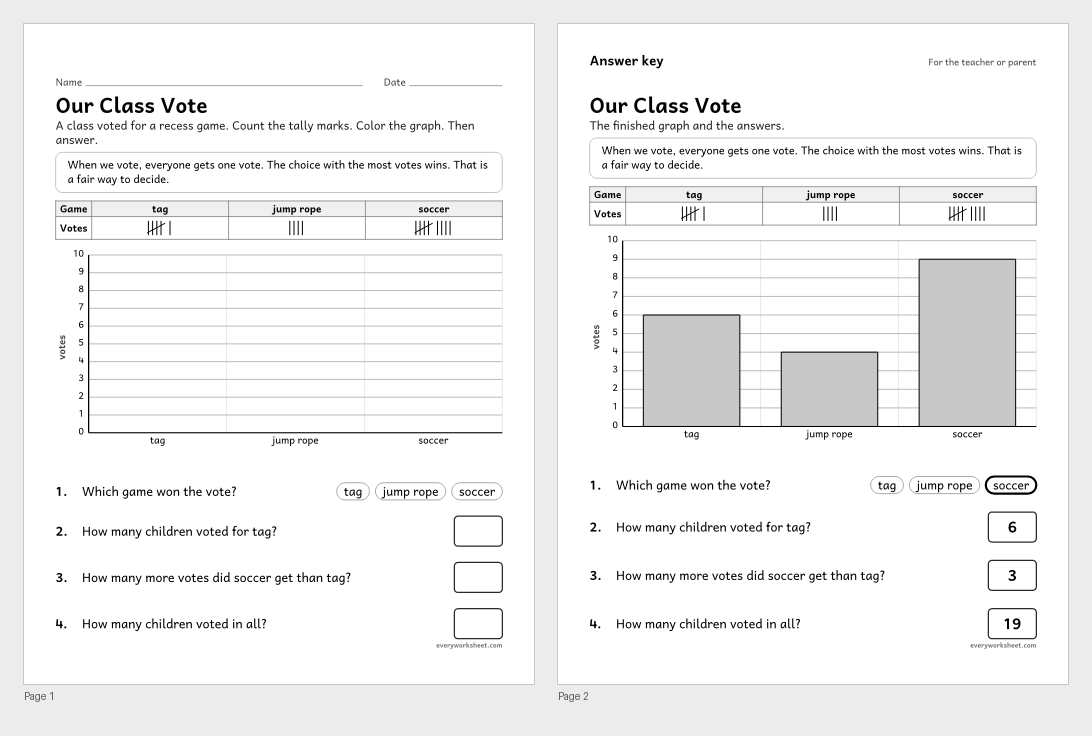
Voting to make a fair group decision and graphing the results
Answer key on page 2
2 pages42 KB
 View all 2 pages
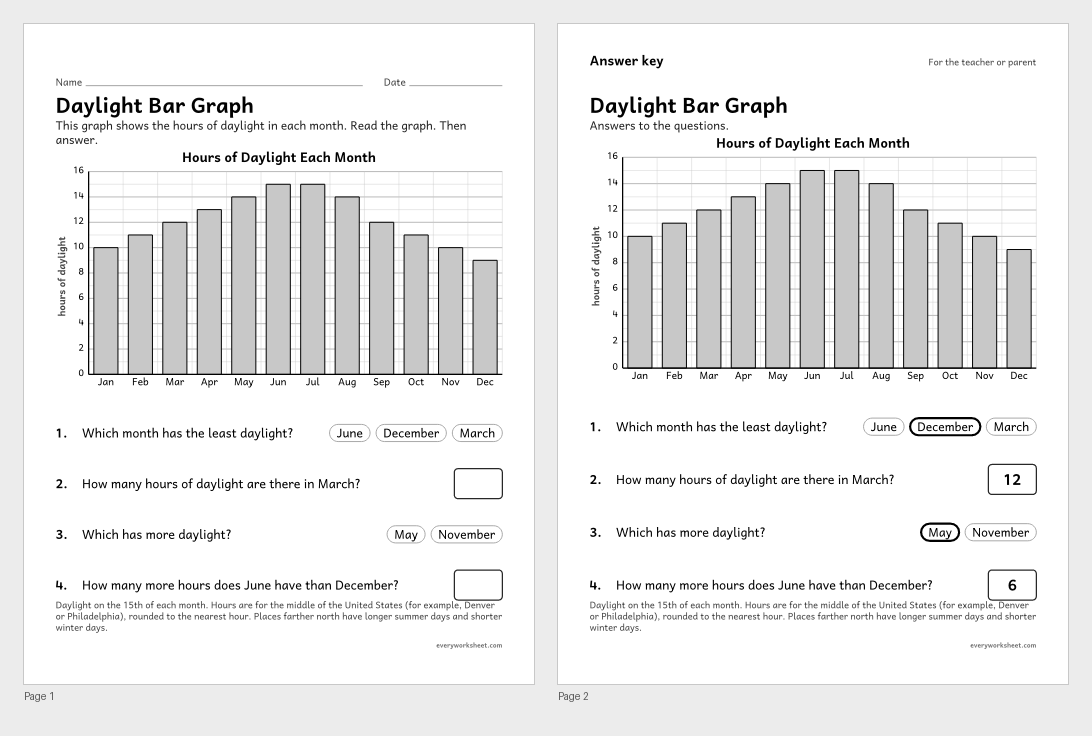
Reading a bar graph of daylight hours through the year
Answer key on page 2
2 pages41 KB
 View all 2 pages
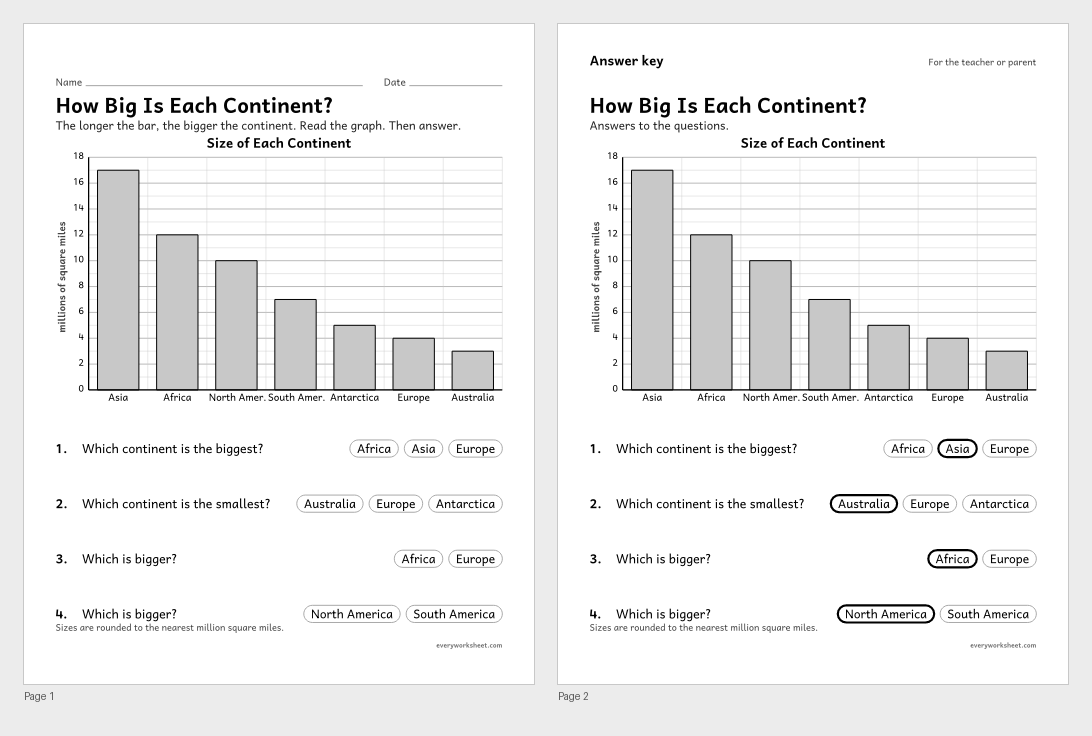
Comparing the sizes of the continents on a bar graph
Answer key on page 2
2 pages39 KB
 View all 2 pages
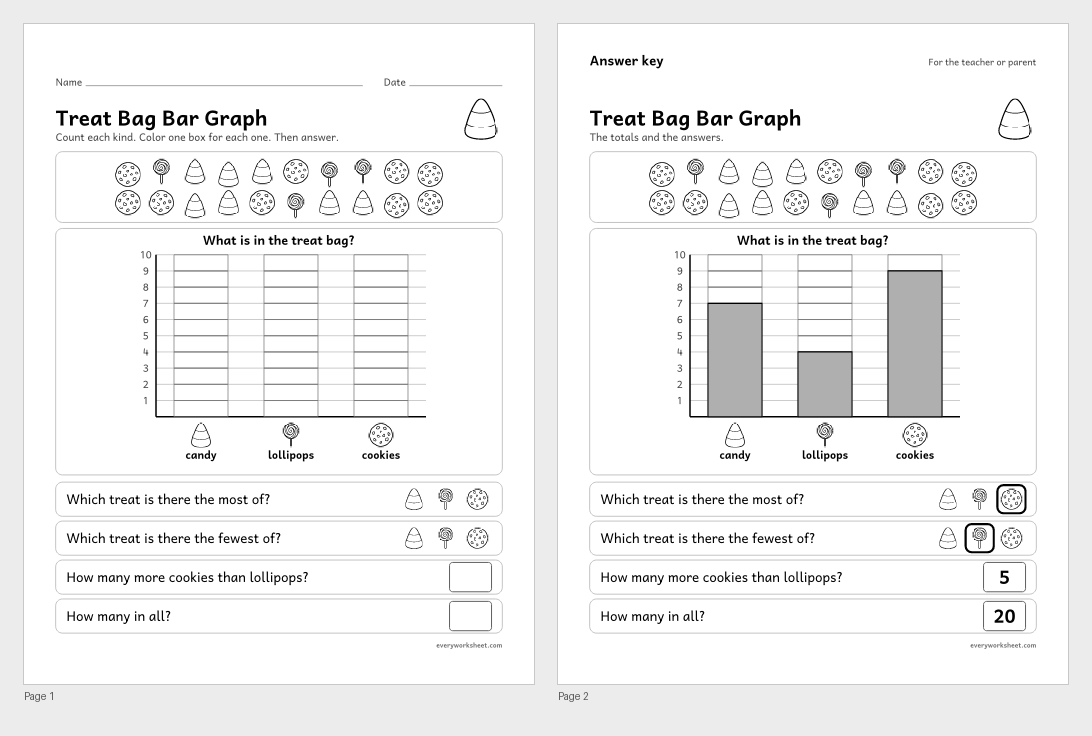
Counting treats into a bar graph and comparing the totals
Answer key on page 2
2 pages1.1 MB
 View all 2 pages
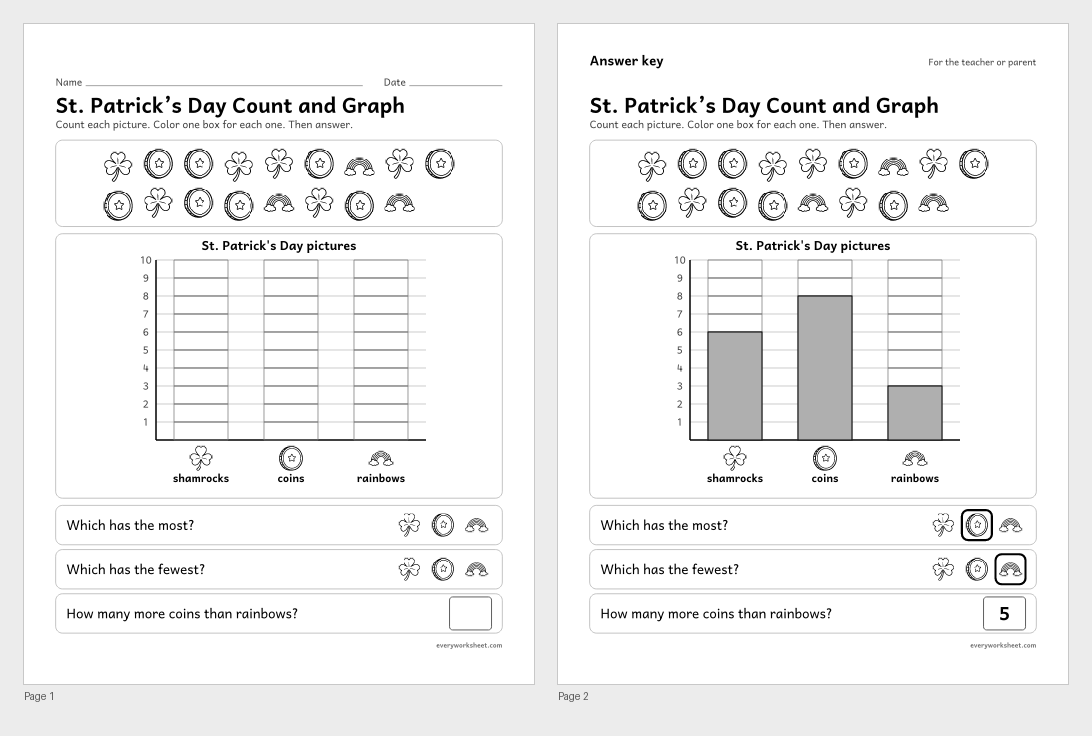
Counting pictures, making a bar graph and comparing the groups
Answer key on page 2
2 pages1.2 MB
 View all 2 pages
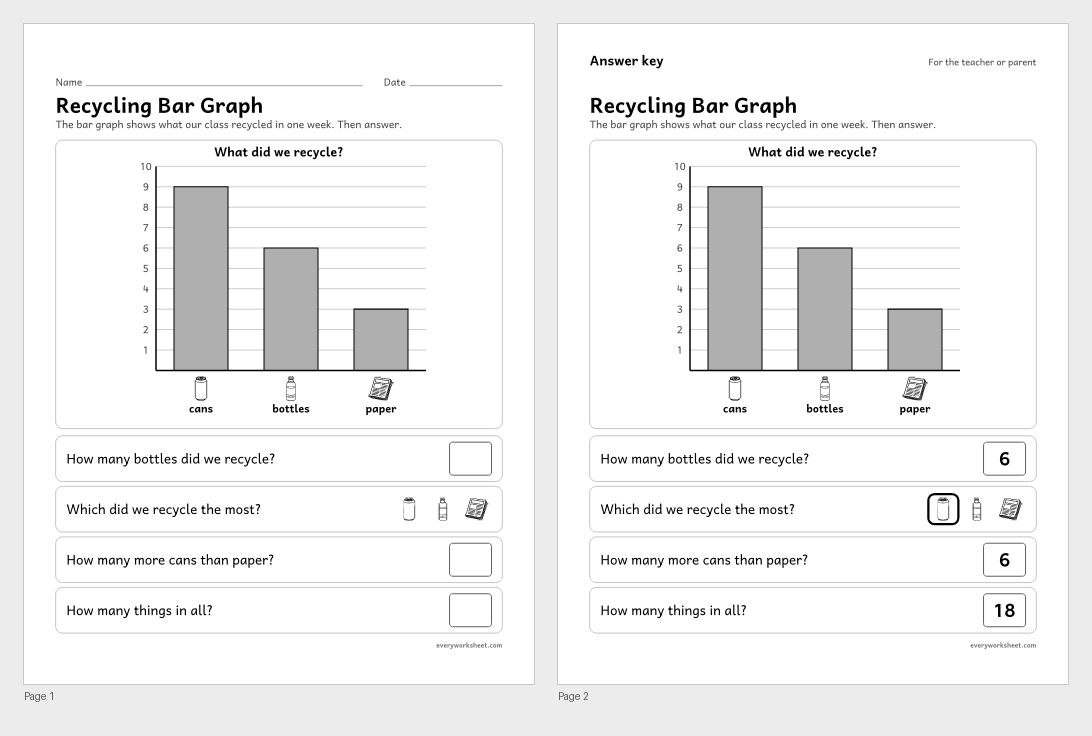
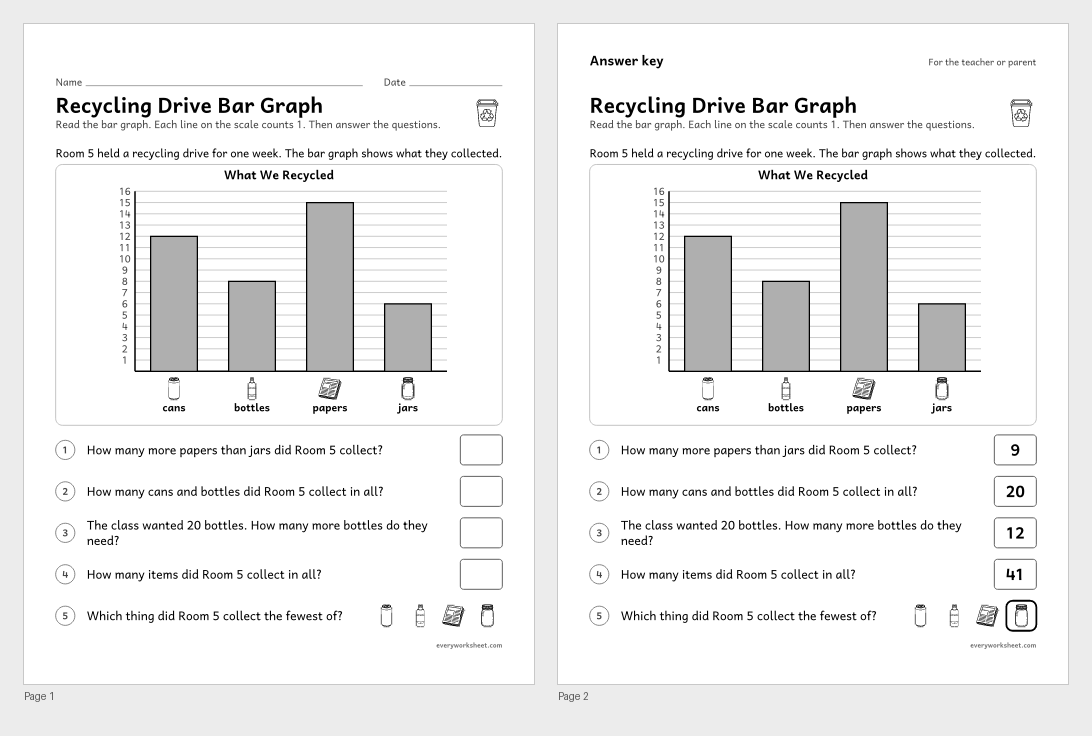
Reading a bar graph of recycling and comparing the totals
Answer key on page 2
2 pages62 KB
 View all 2 pages
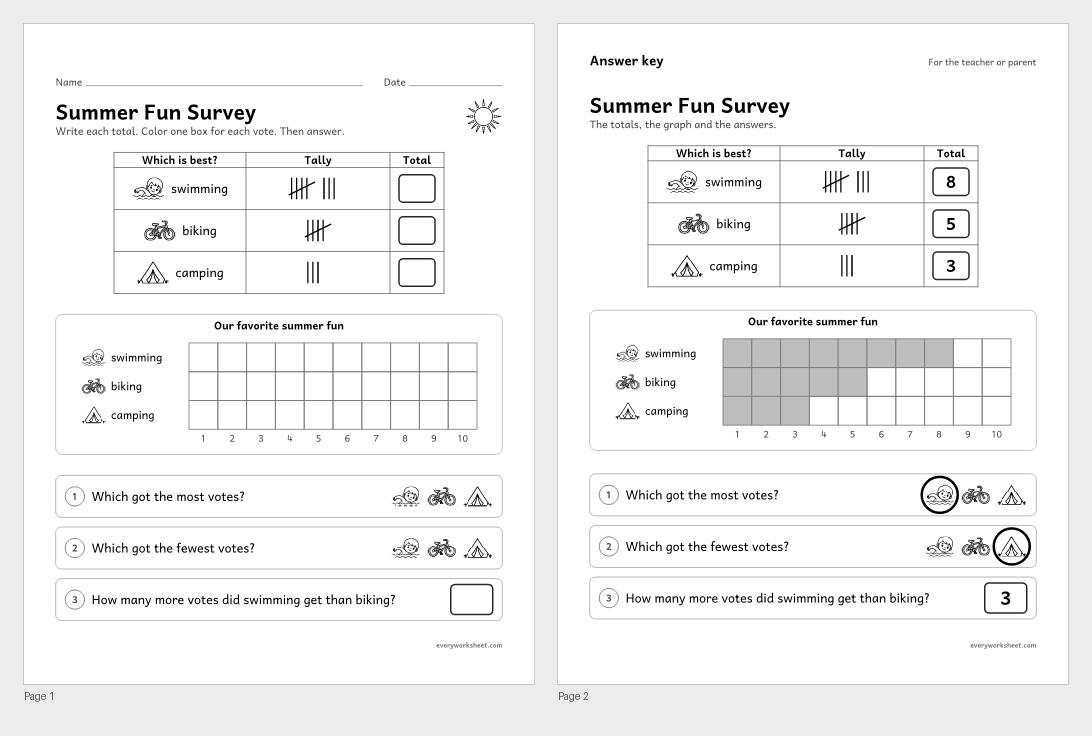
Organizing survey data in a tally chart and bar graph and comparing the totals
Answer key on page 2
2 pages596 KB
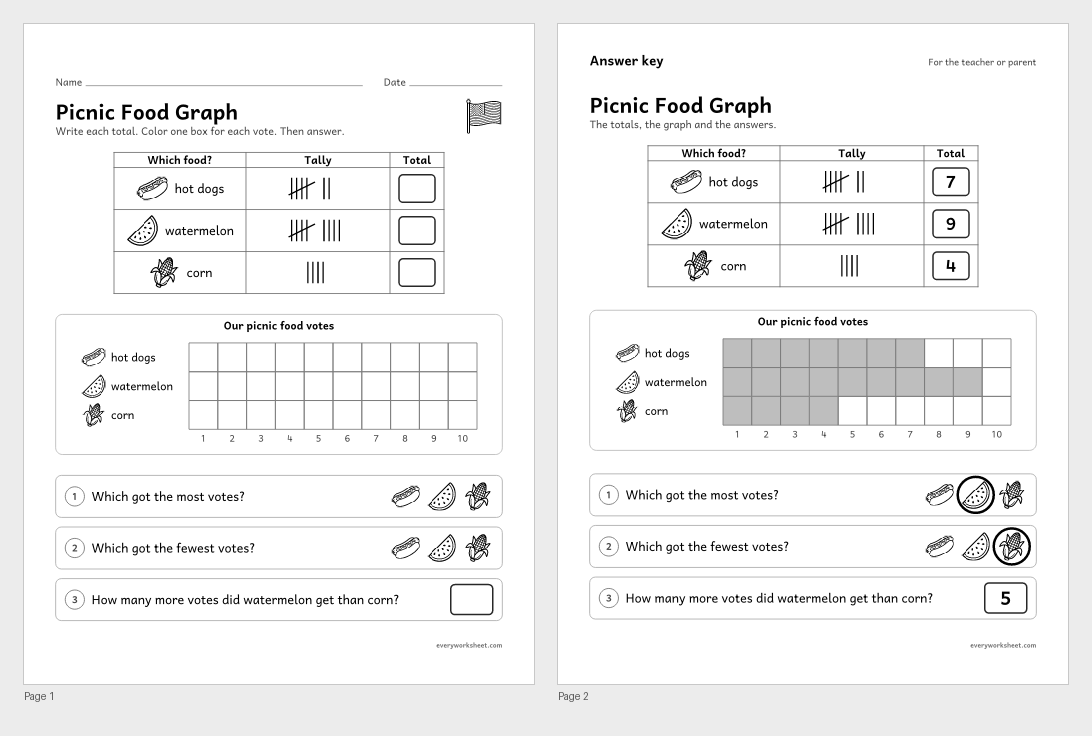 View all 2 pages
Organizing survey data in a tally chart and bar graph and comparing the totals
Answer key on page 2
2 pages703 KB
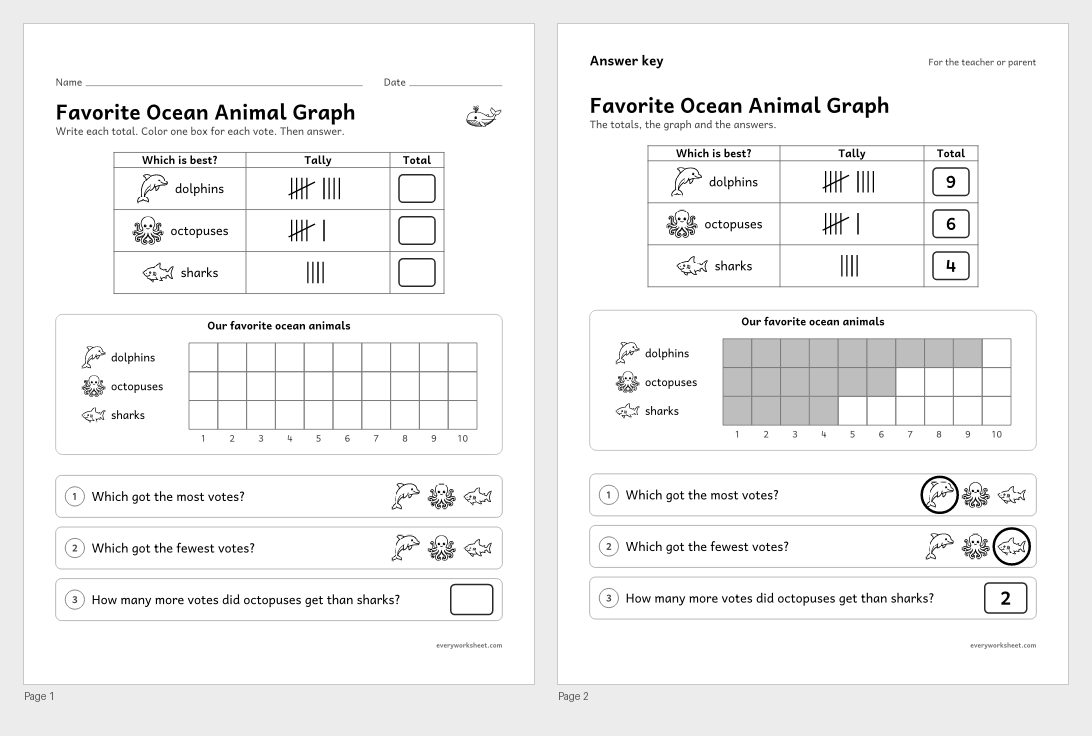 View all 2 pages
Organizing survey data in a tally chart and bar graph and comparing the totals
Answer key on page 2
2 pages326 KB
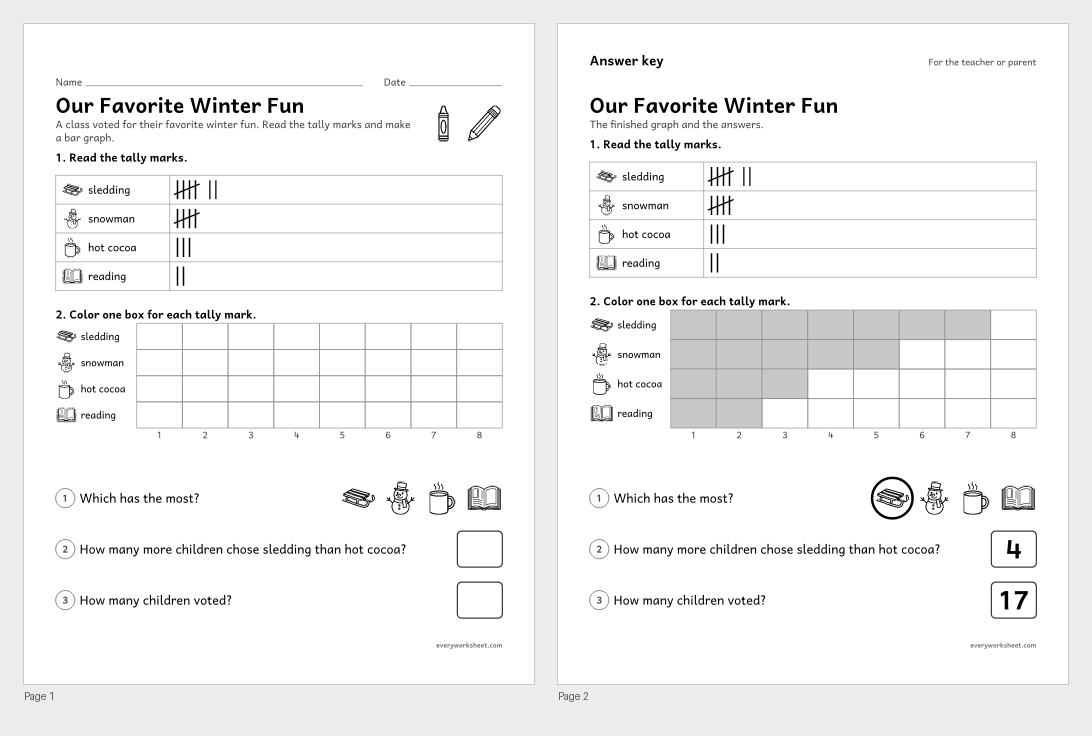 View all 2 pages
Reading tally marks, making a bar graph and comparing
Answer key on page 2
2 pages502 KB
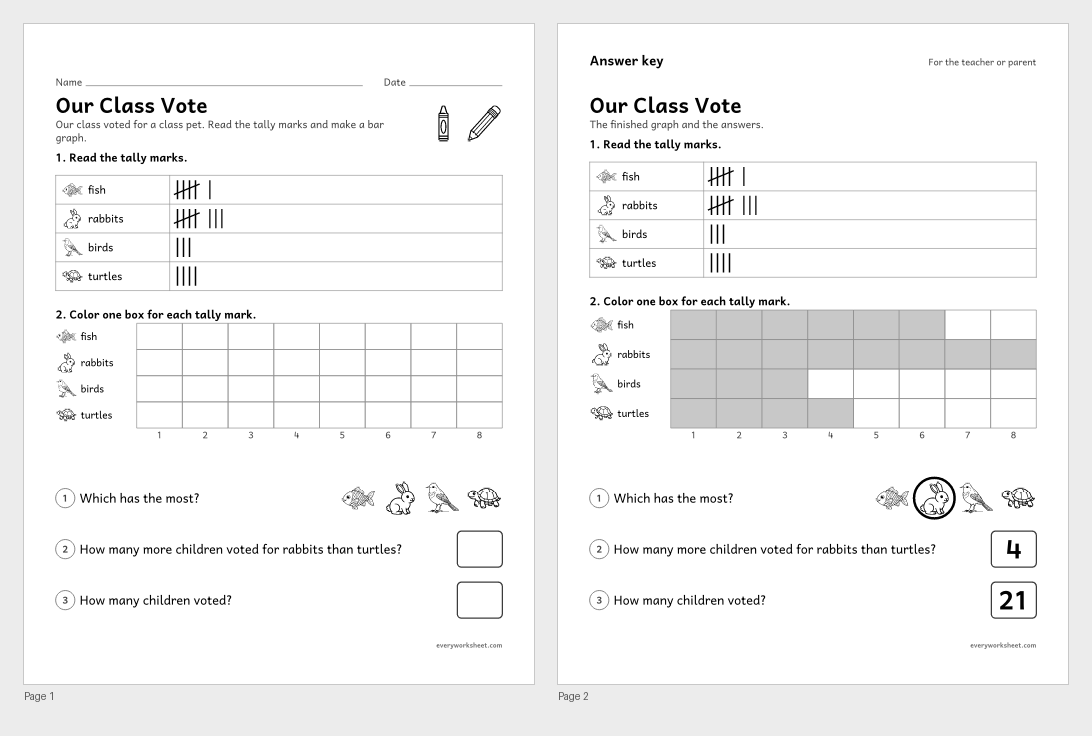 View all 2 pages
Reading tally marks, making a bar graph and comparing
Answer key on page 2
2 pages469 KB
 View all 2 pages
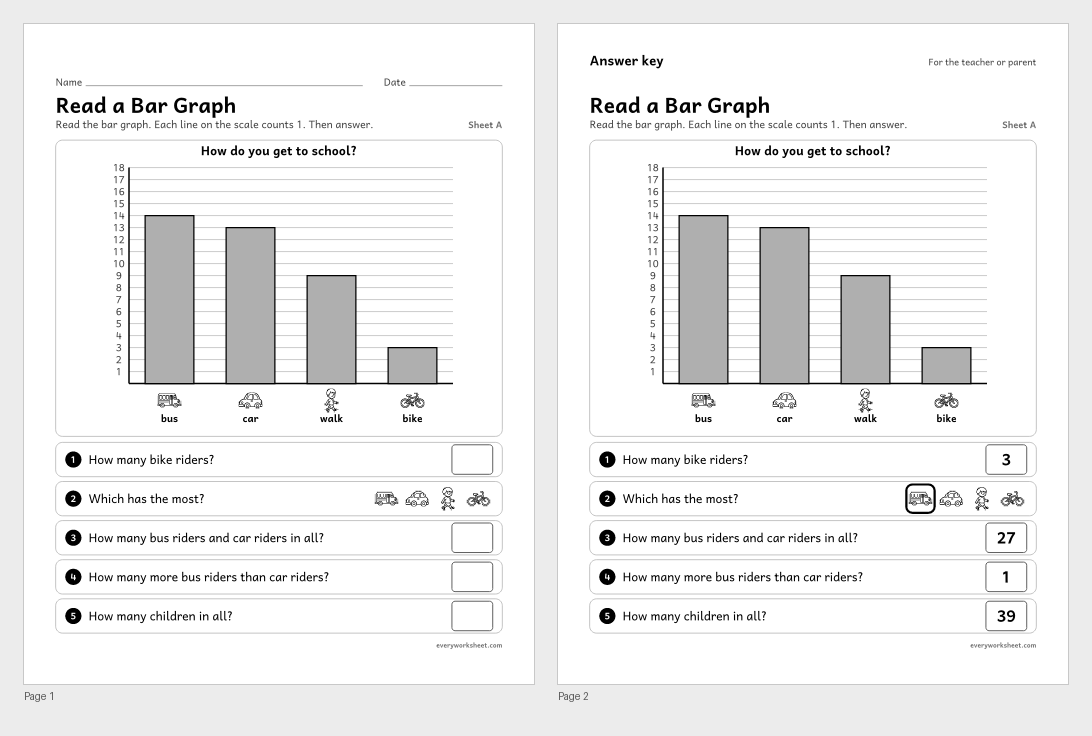
Reading a bar graph with a single-unit scale and four categories
Answer key on page 2
2 pages313 KB
 View all 2 pages
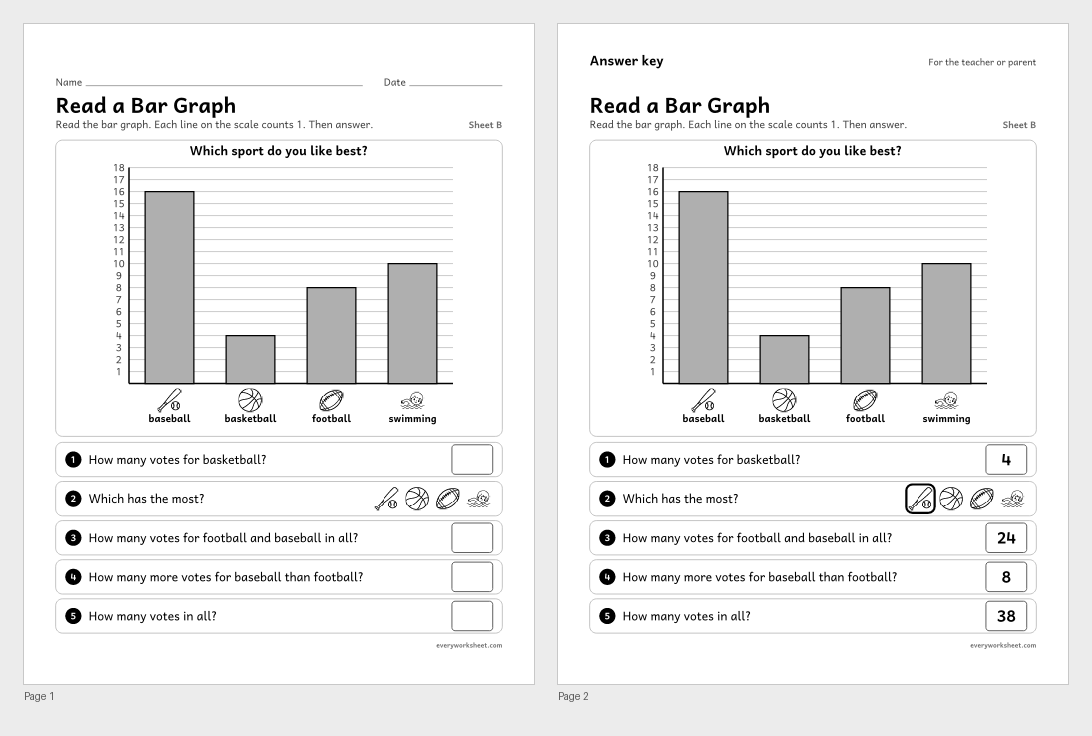
Reading a bar graph with a single-unit scale and four categories
Answer key on page 2
2 pages394 KB
 View all 2 pages
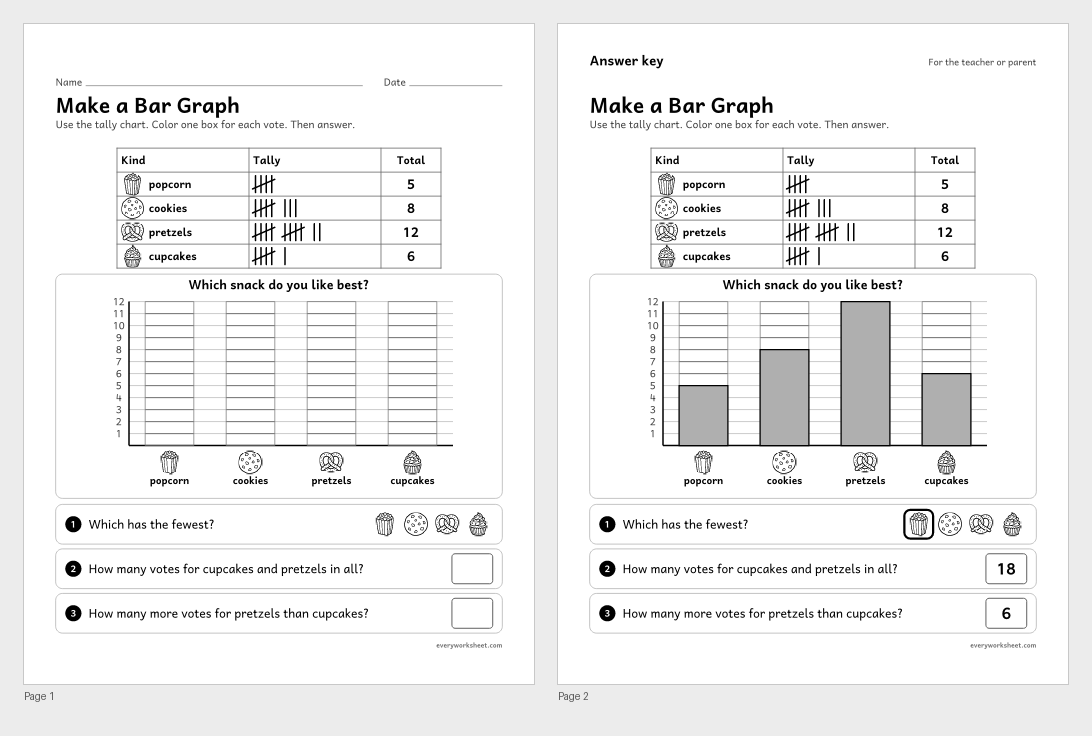
Making a bar graph with a single-unit scale from a tally chart
Answer key on page 2
2 pages669 KB
 View all 2 pages
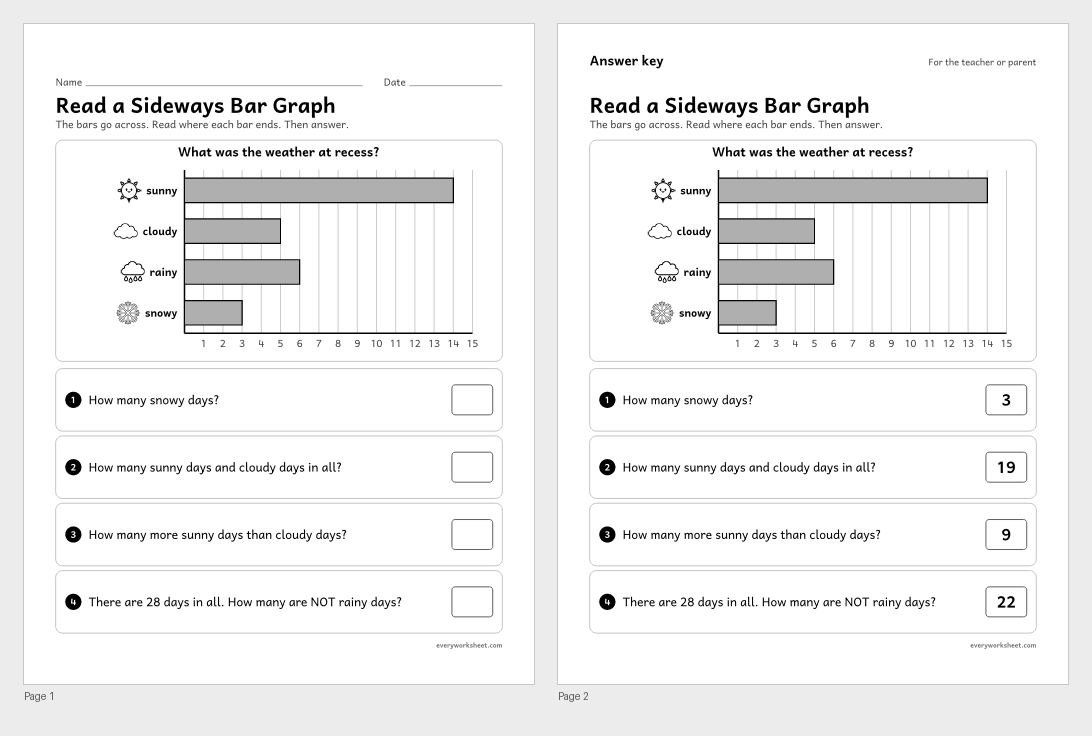
Reading a horizontal bar graph with four categories
Answer key on page 2
2 pages86 KB
 View all 2 pages
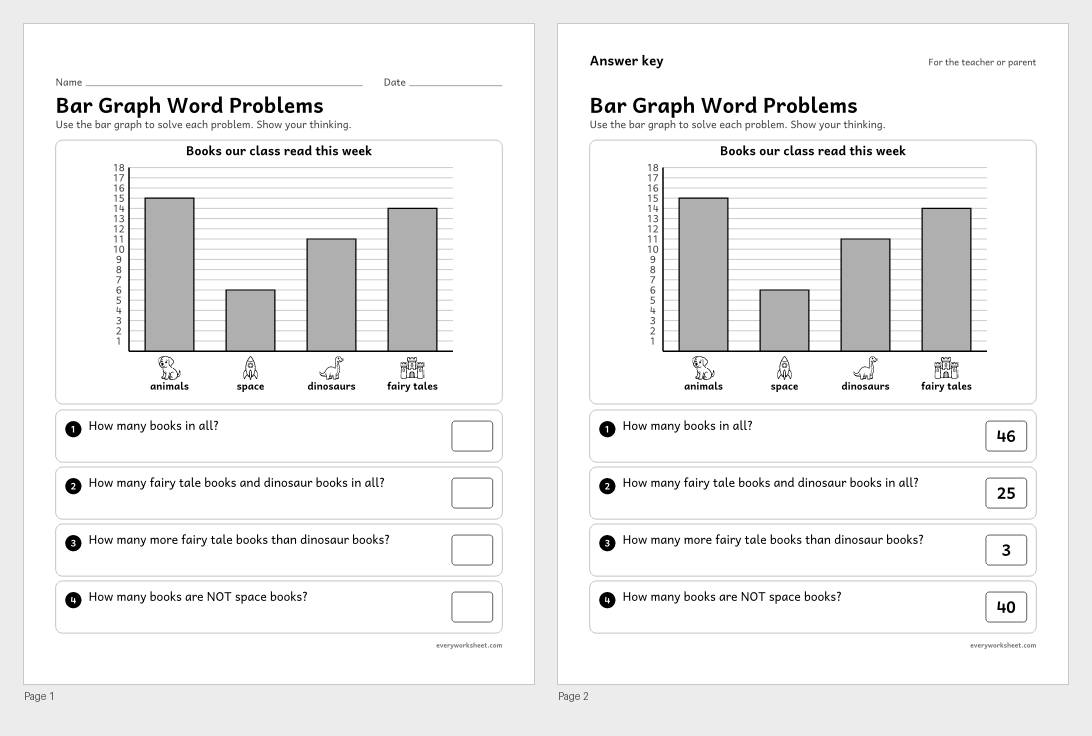
Solving put-together, take-apart and compare problems with a bar graph
Answer key on page 2
2 pages151 KB
 View all 2 pages
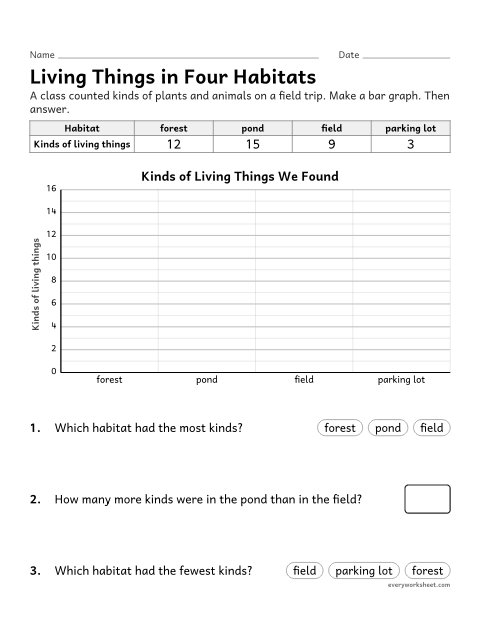
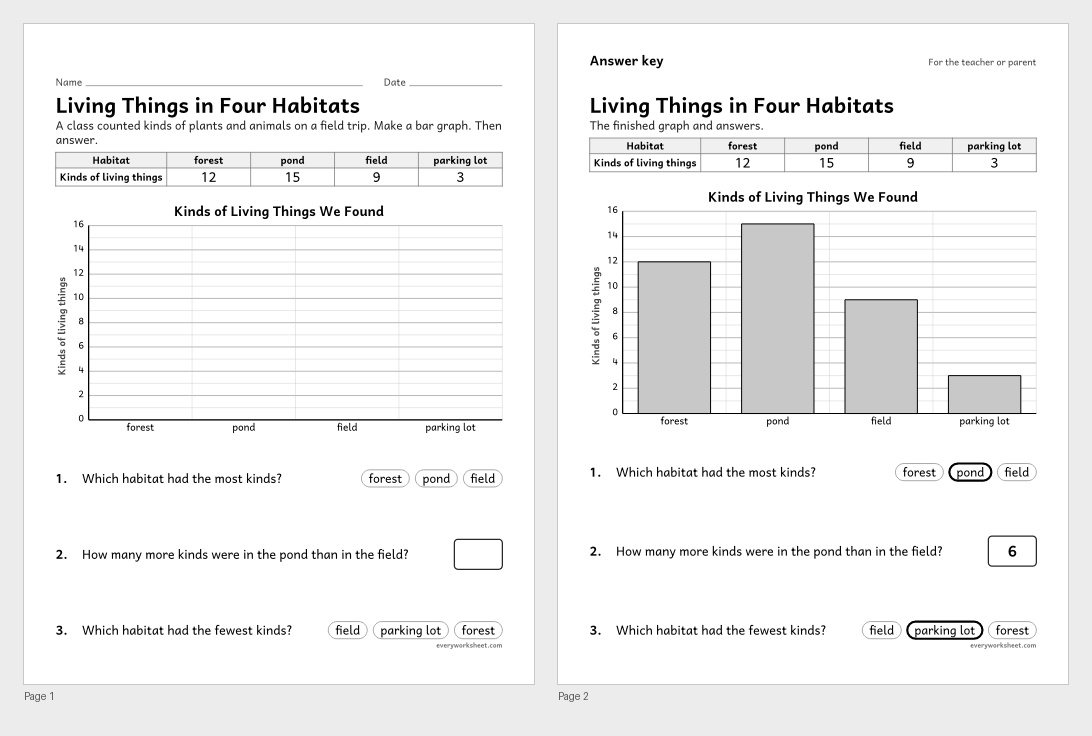
Making a bar graph to compare the diversity of life in different habitats
Answer key on page 2
2 pages42 KB
 View all 2 pages
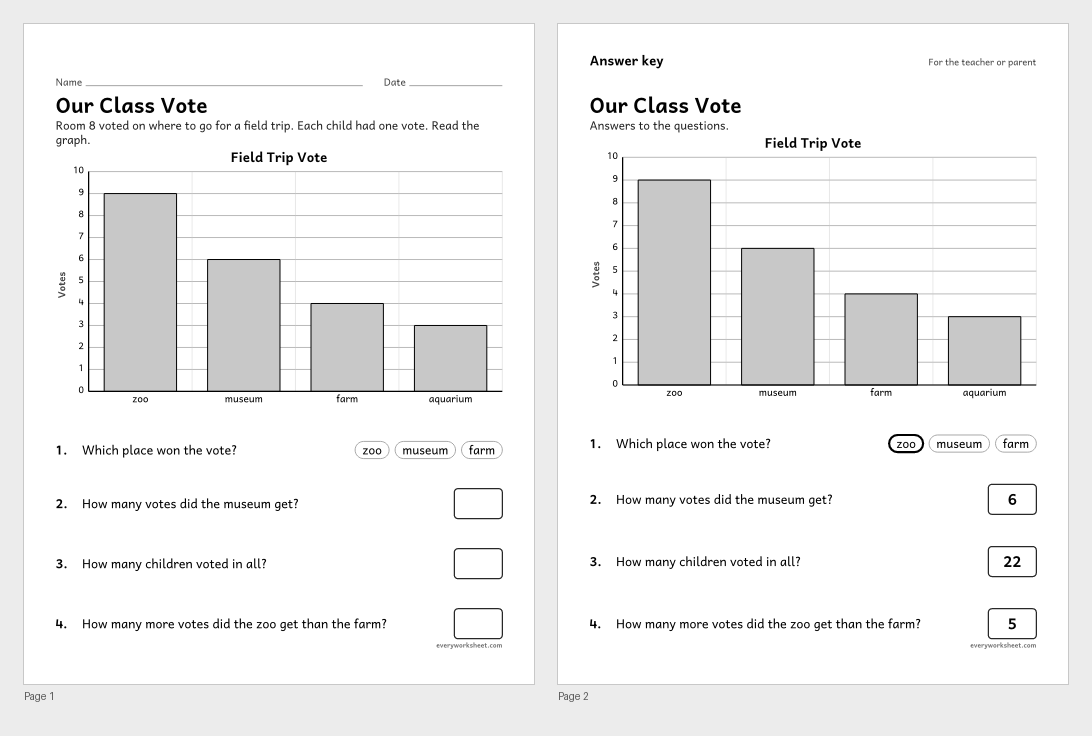
Reading the results of a class vote on a bar graph
Answer key on page 2
2 pages37 KB
 View all 2 pages
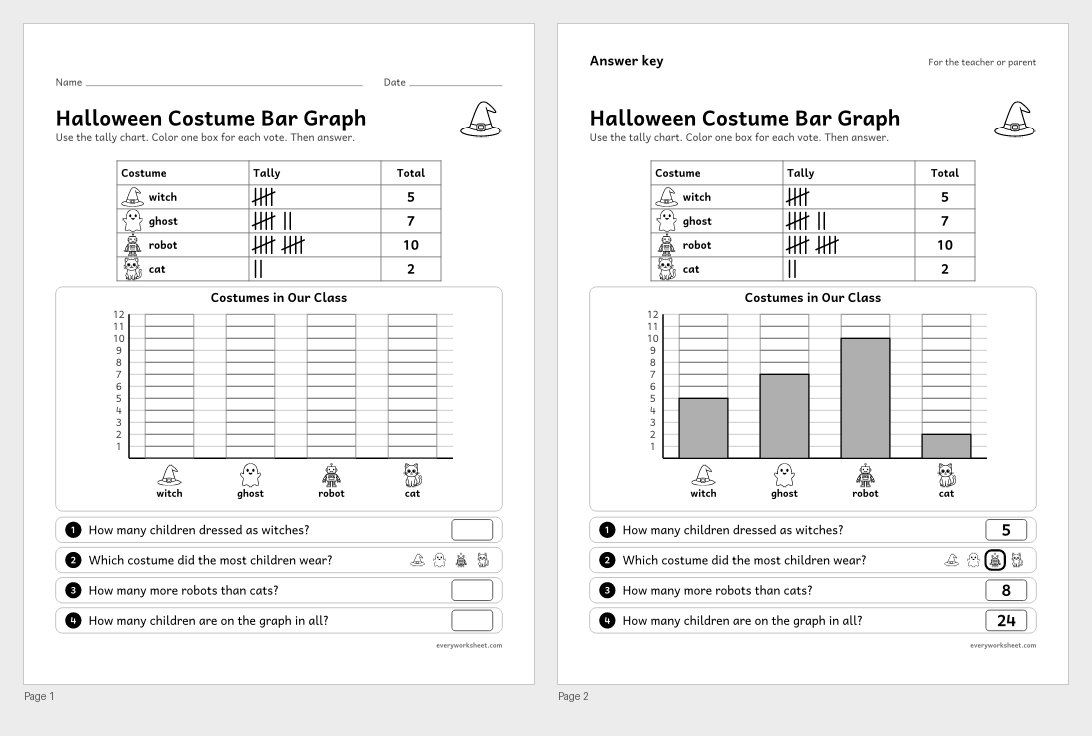
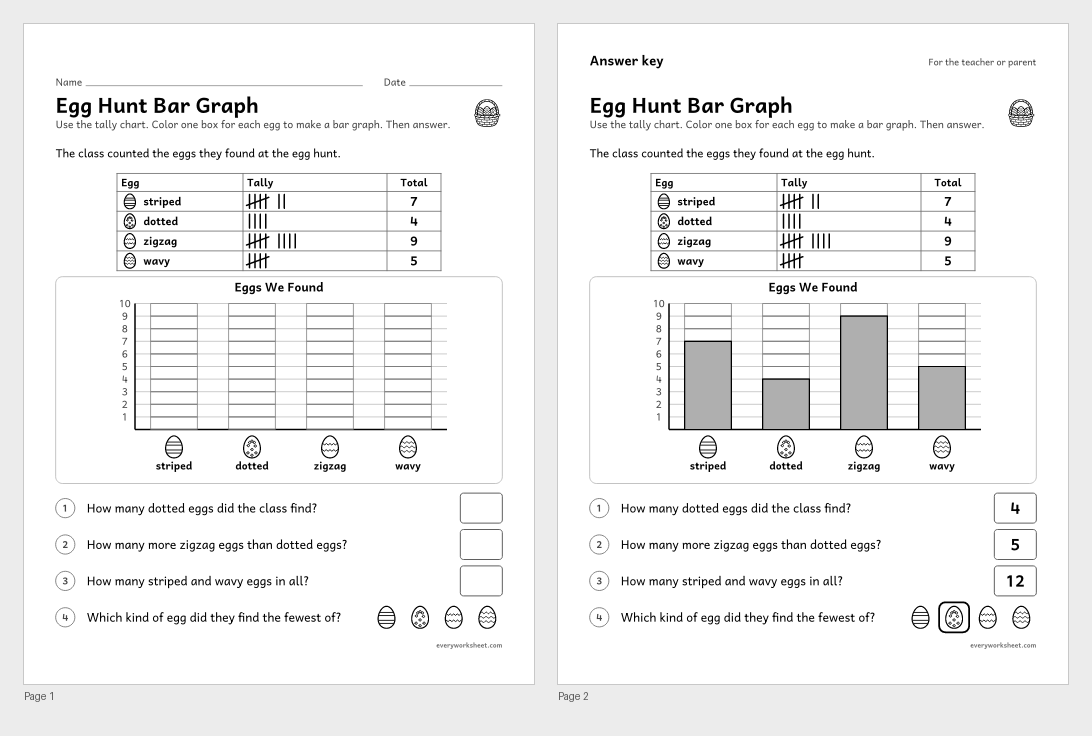
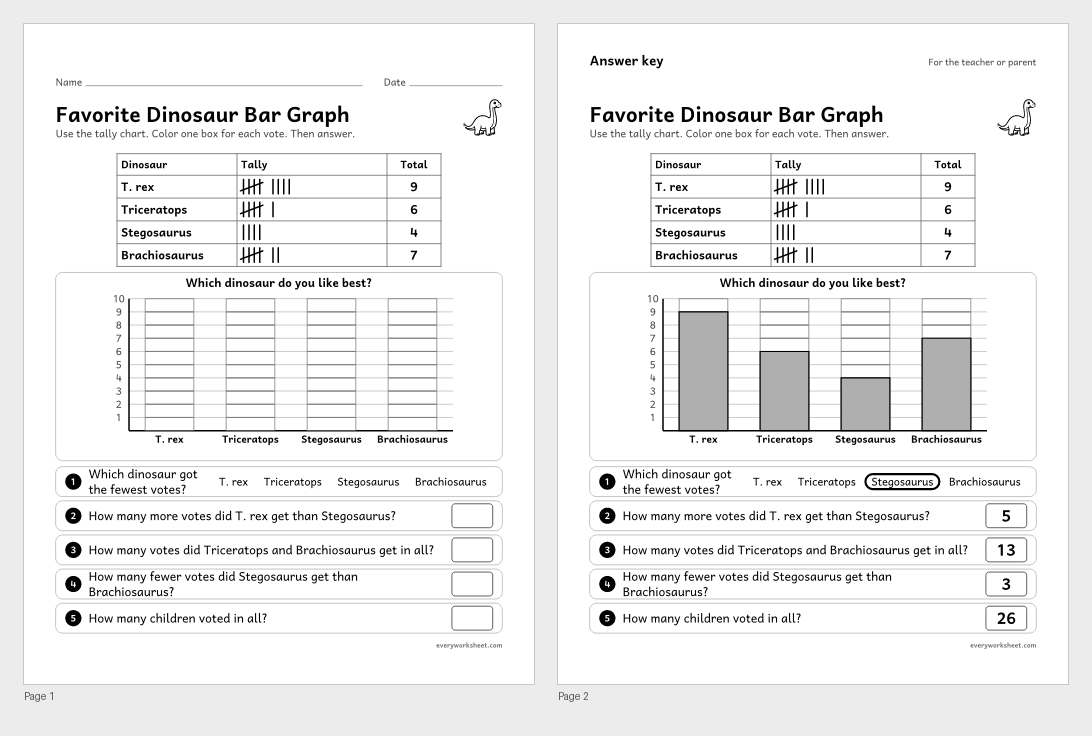
Drawing a bar graph from a tally chart and answering compare questions
Answer key on page 2
2 pages482 KB
 View all 2 pages
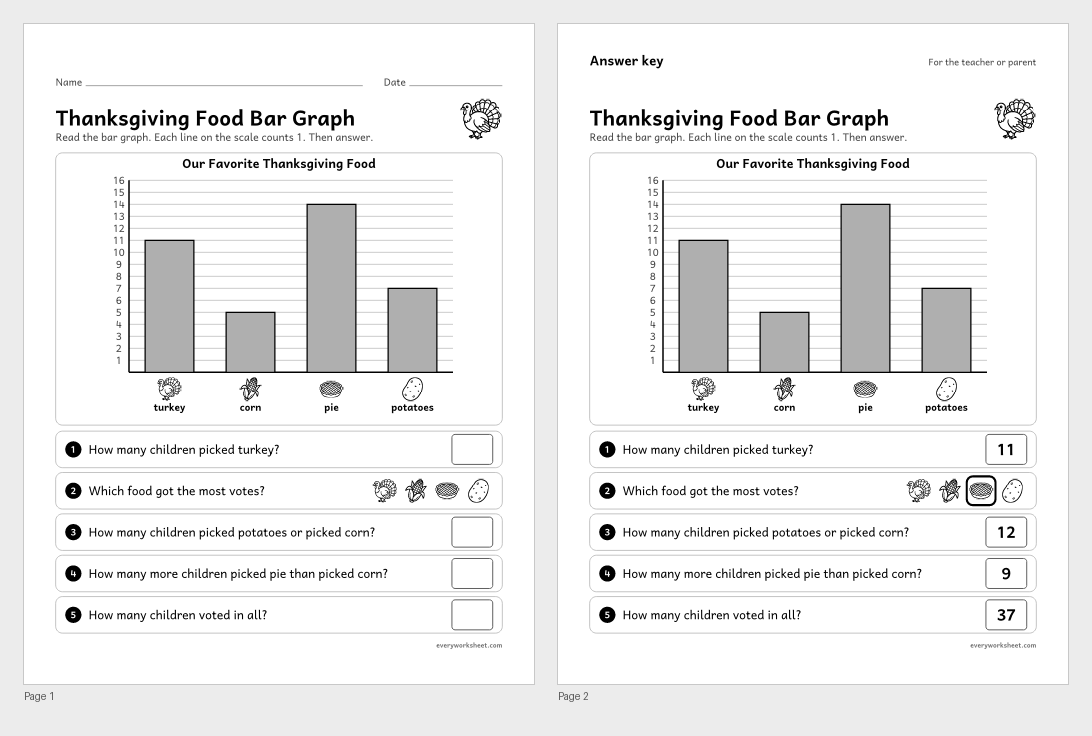
Reading a bar graph with a single-unit scale and solving put-together and compare problems
Answer key on page 2
2 pages618 KB
 View all 2 pages
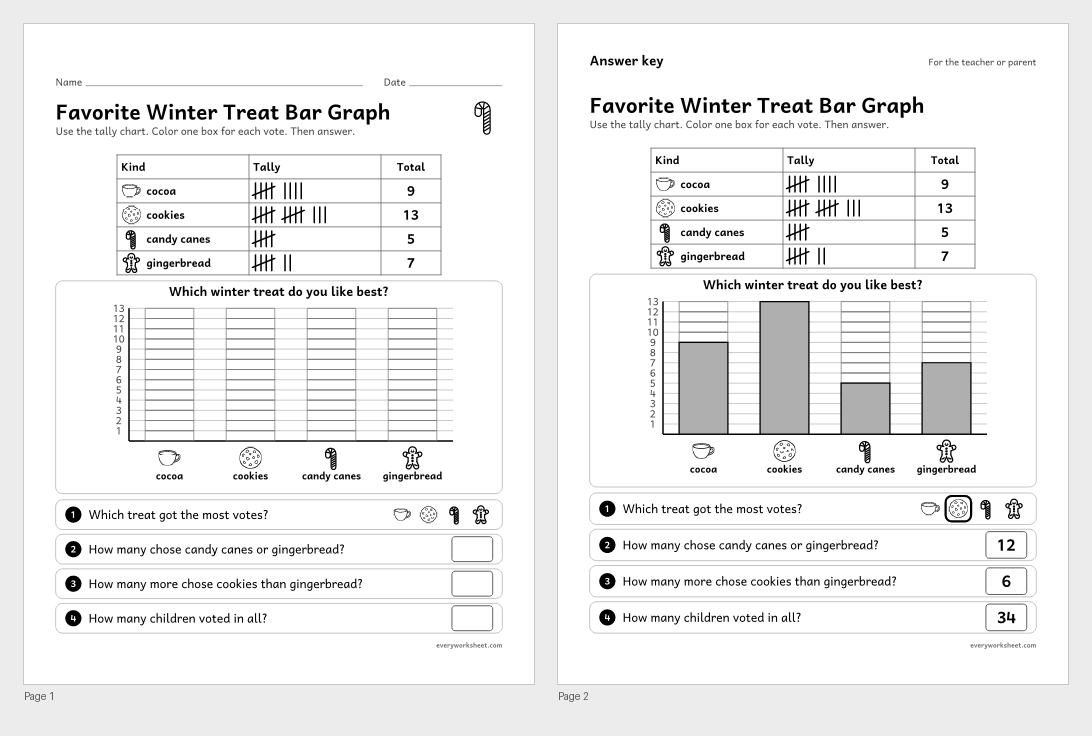
Making and reading a bar graph with a single-unit scale
Answer key on page 2
2 pages274 KB
 View all 2 pages
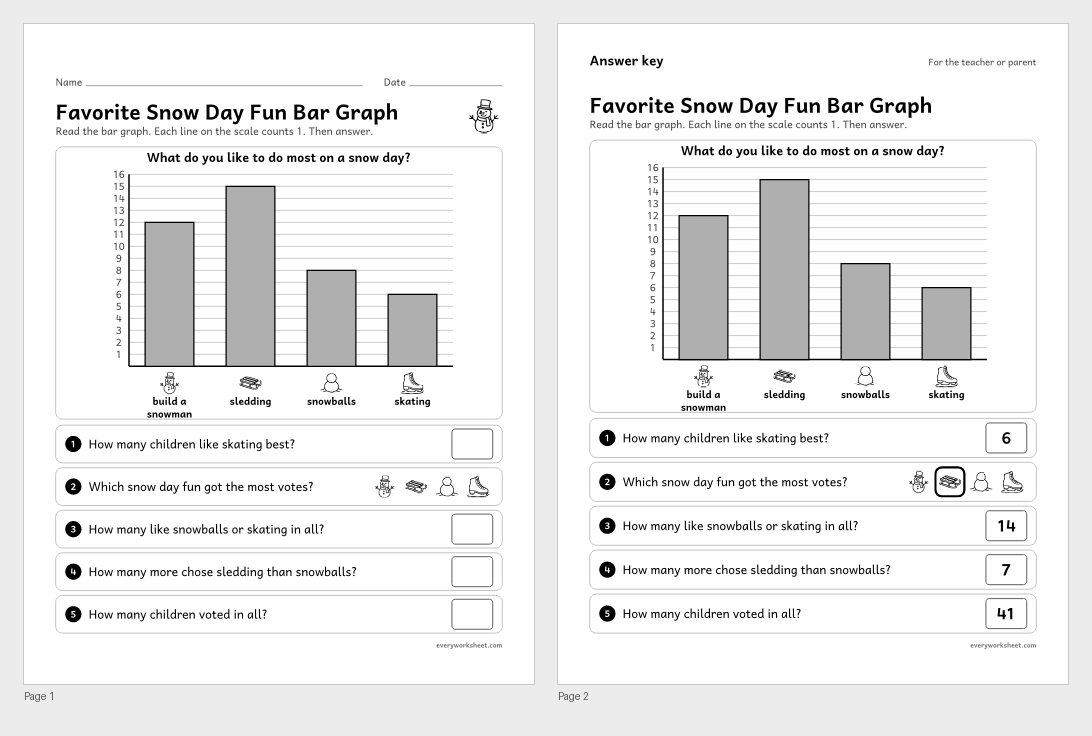
Reading a bar graph and solving put-together, take-apart and compare problems
Answer key on page 2
2 pages381 KB
 View all 2 pages
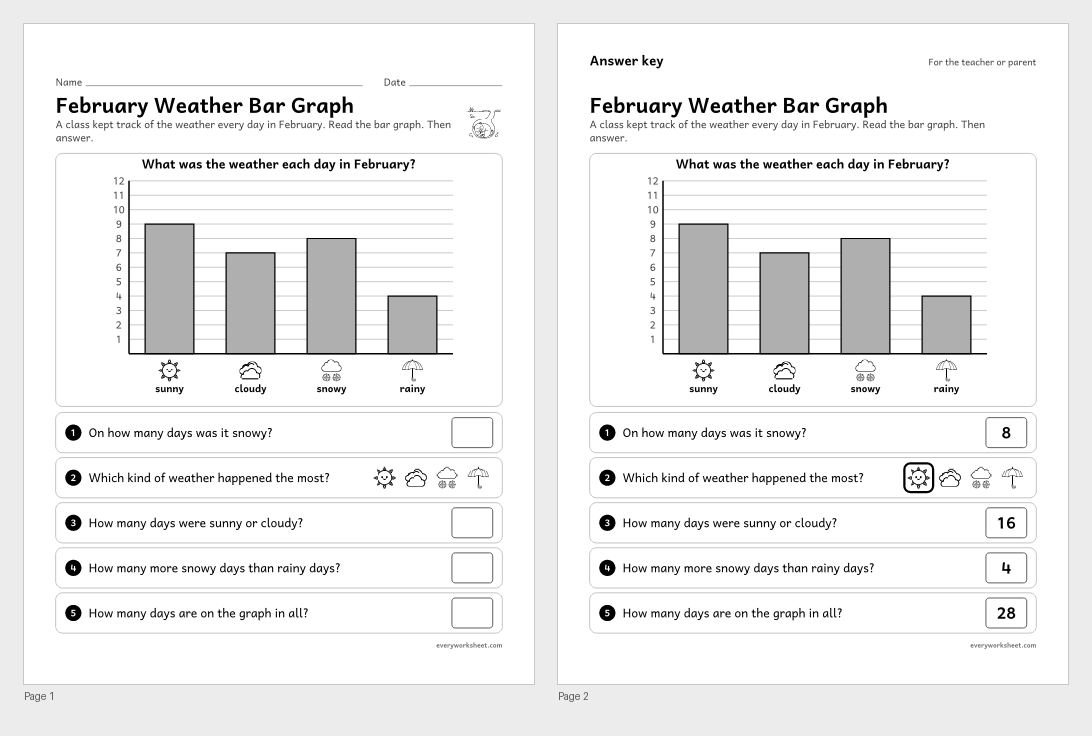
Reading a bar graph and solving put-together, take-apart and compare problems
Answer key on page 2
2 pages136 KB
 View all 2 pages
Drawing a bar graph from a tally chart and solving put-together and compare problems
Answer key on page 2
2 pages138 KB
 View all 2 pages
Reading a bar graph and solving put-together, take-apart and compare problems
Answer key on page 2
2 pages120 KB
 View all 2 pages
Making a bar graph and solving put-together, take-apart and compare problems with it
Answer key on page 2
2 pages84 KB
 View all 2 pages
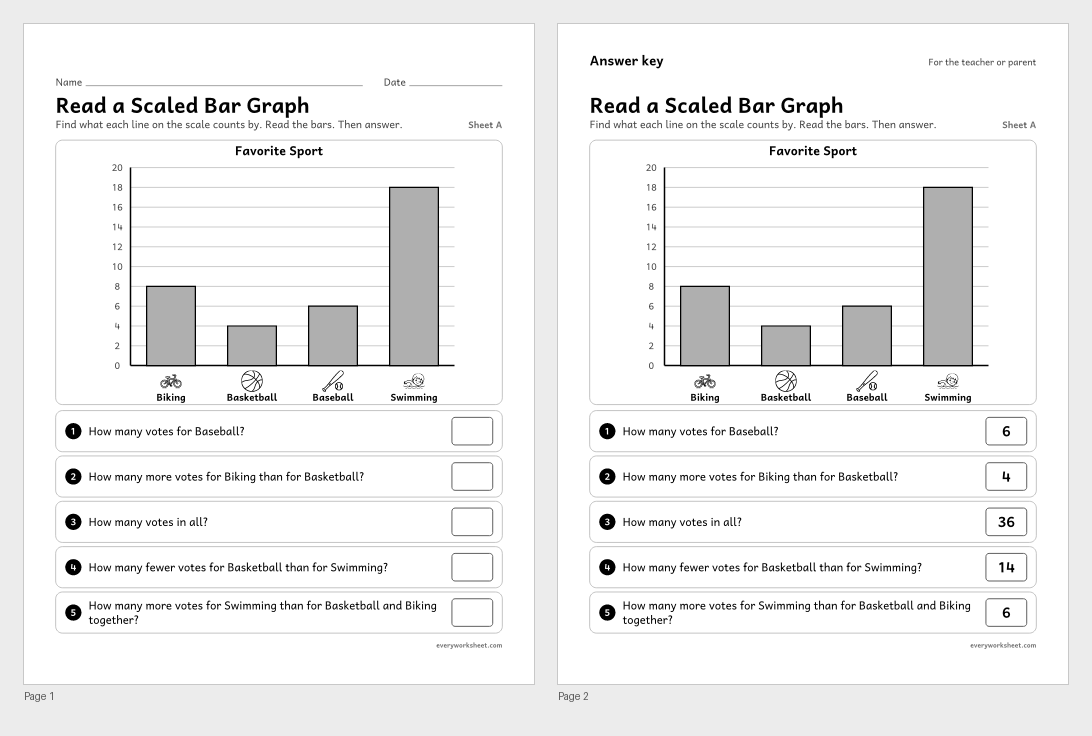
Reading a bar graph with a scale that counts by 2s and solving how many more and how many fewer problems
Answer key on page 2
2 pages217 KB
 View all 2 pages
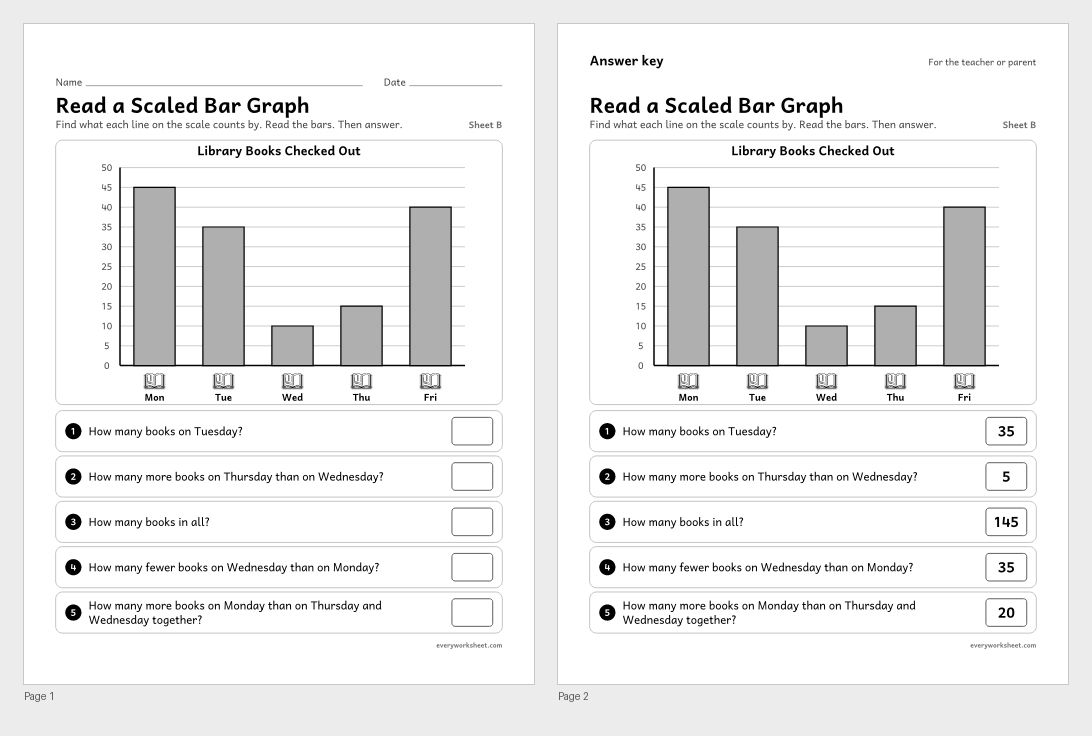
Reading a bar graph with a scale that counts by 5s and solving how many more and how many fewer problems
Answer key on page 2
2 pages197 KB
 View all 2 pages
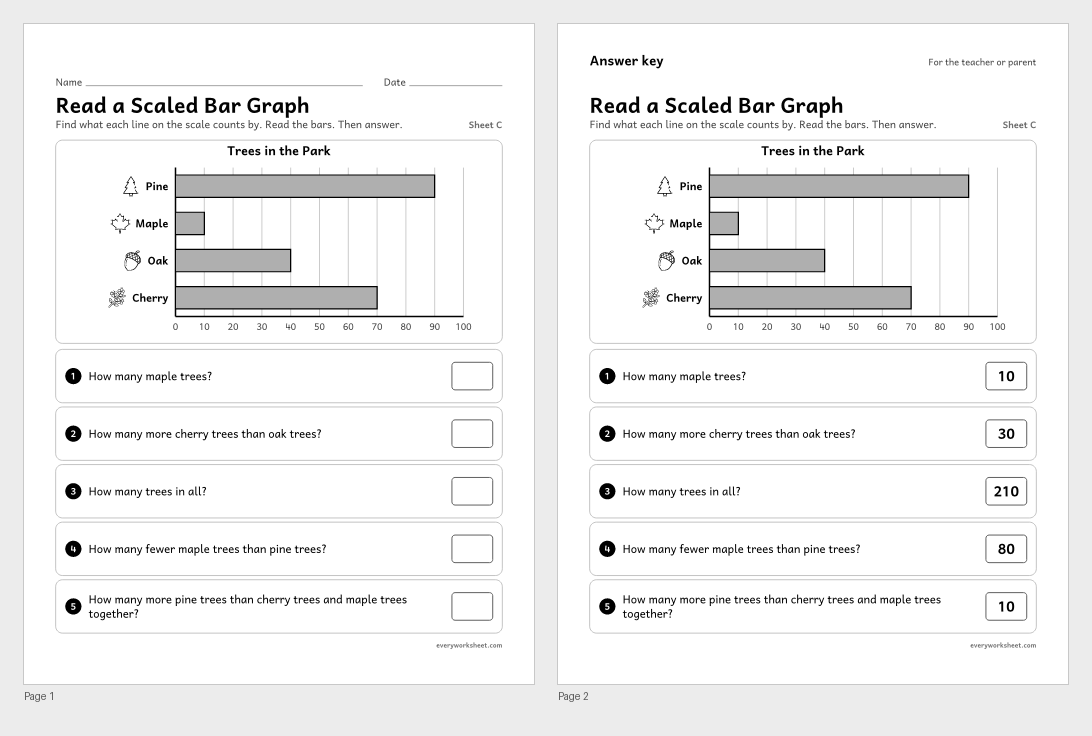
Reading a horizontal bar graph with a scale that counts by 10s and solving how many more and how many fewer problems
Answer key on page 2
2 pages196 KB
 View all 2 pages
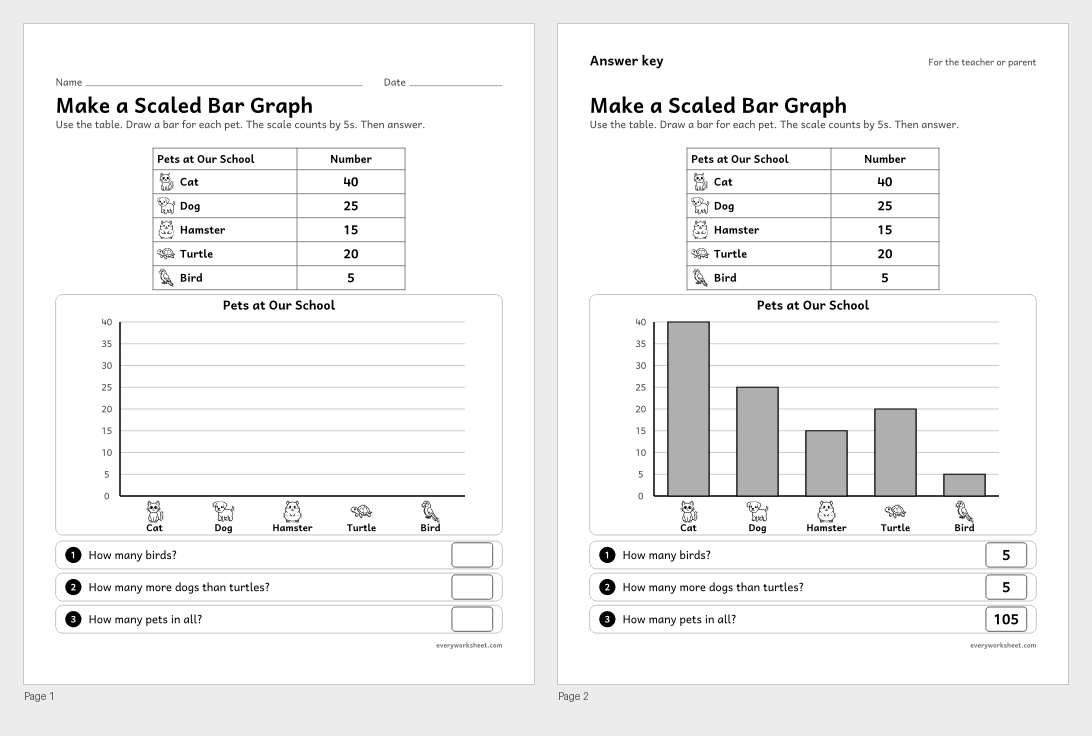
Drawing a bar graph from a table on a scale that counts by 5s
Answer key on page 2
2 pages506 KB
 View all 2 pages
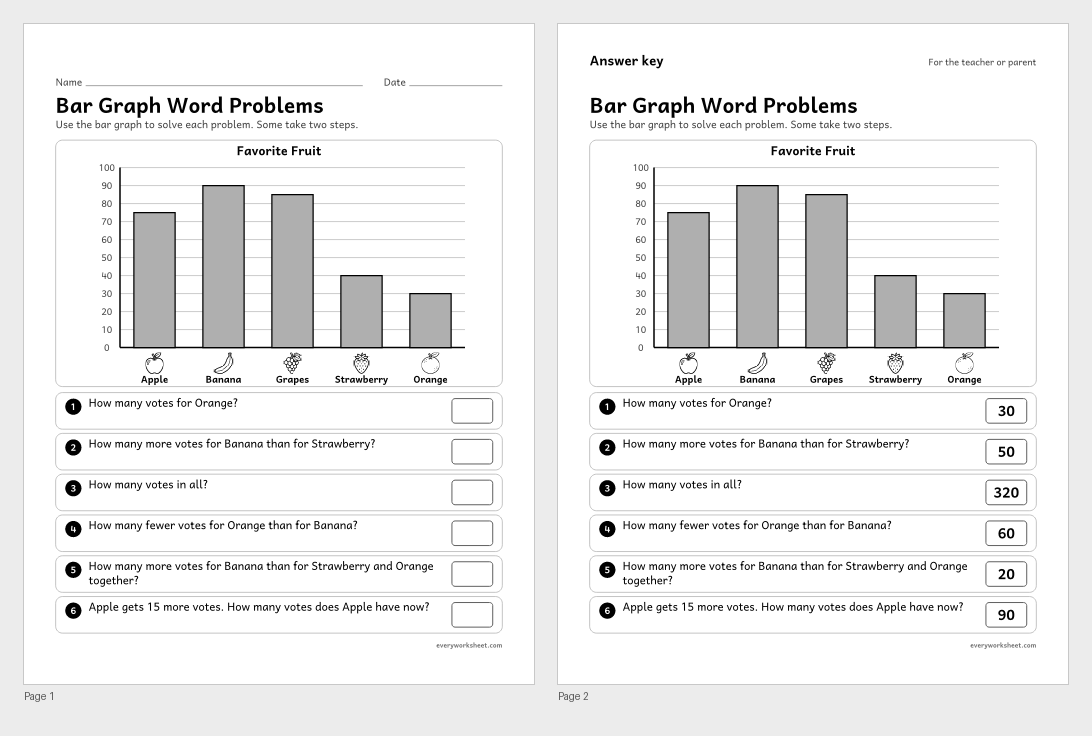
Solving one- and two-step how many more and how many fewer problems from a bar graph that counts by 10s
Answer key on page 2
2 pages227 KB
 View all 2 pages
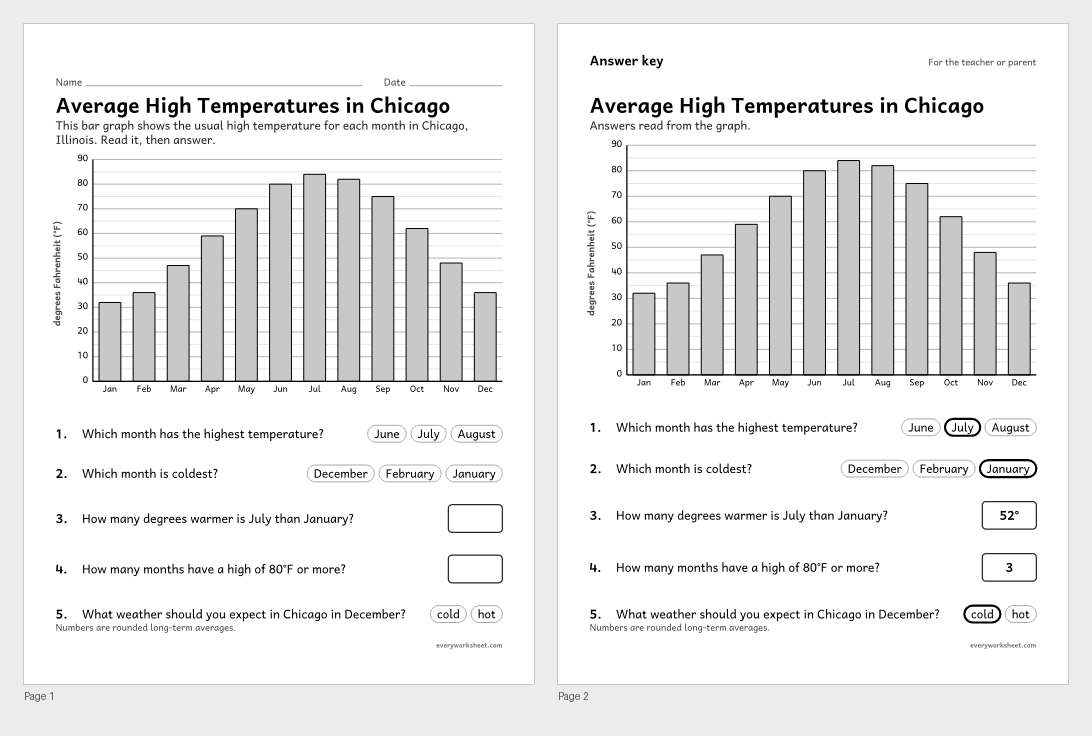
Reading a scaled bar graph of monthly temperatures to describe the weather expected in each season
Answer key on page 2
2 pages42 KB
 View all 2 pages
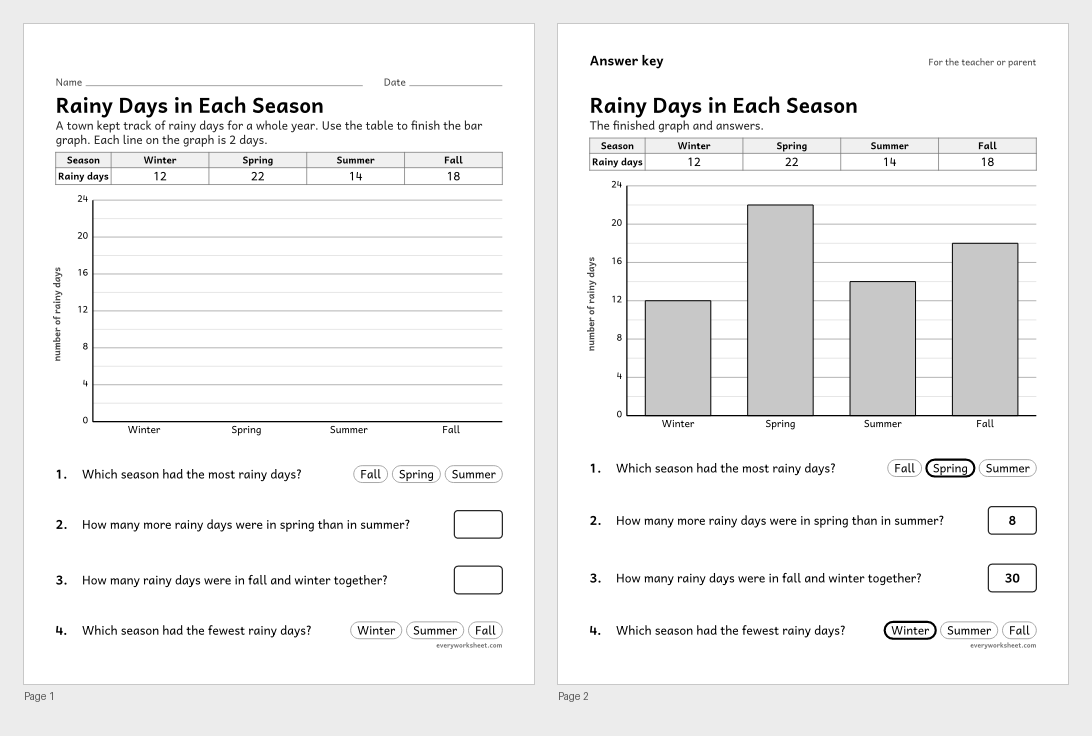
Making a scaled bar graph of weather data by season and solving how-many-more problems
Answer key on page 2
2 pages43 KB
 View all 2 pages
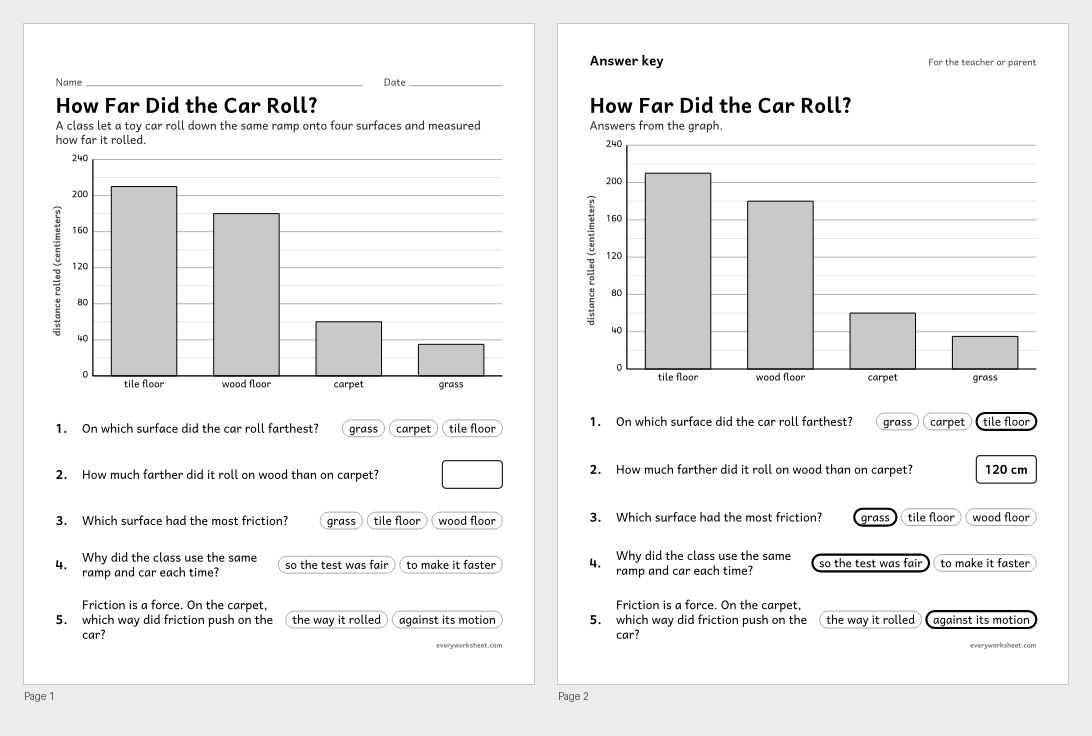
Reading a scaled bar graph of an investigation into friction on different surfaces
Answer key on page 2
2 pages39 KB
 View all 2 pages
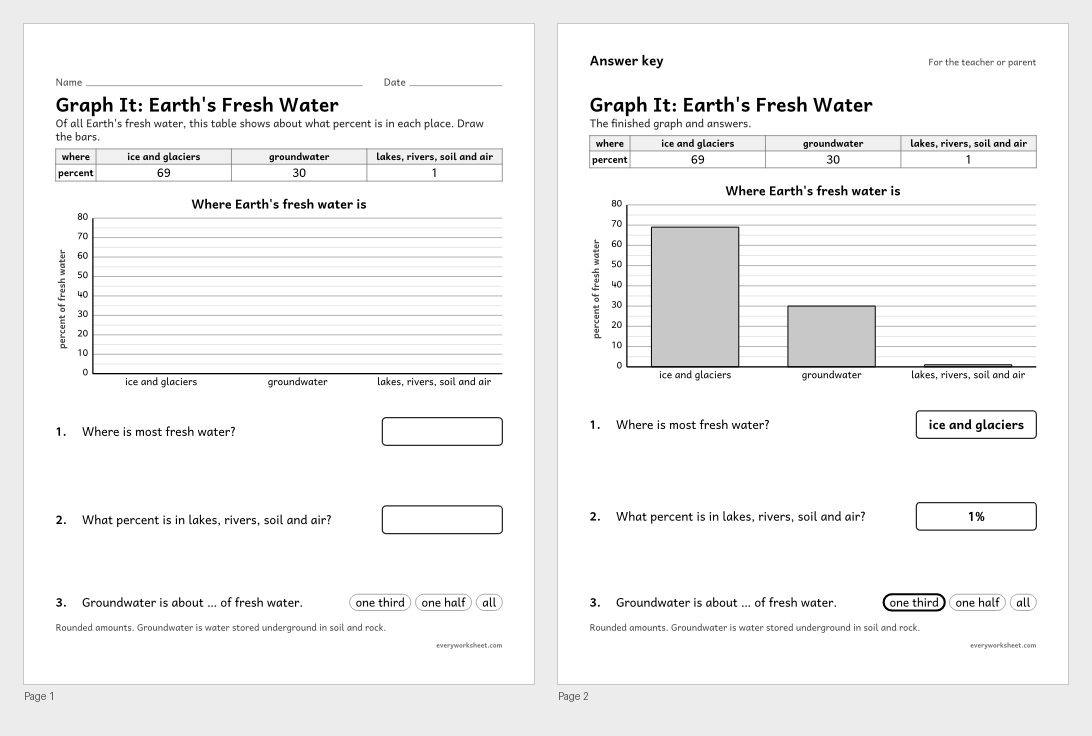
Graphing the amounts of fresh water in different reservoirs
Answer key on page 2
2 pages41 KB
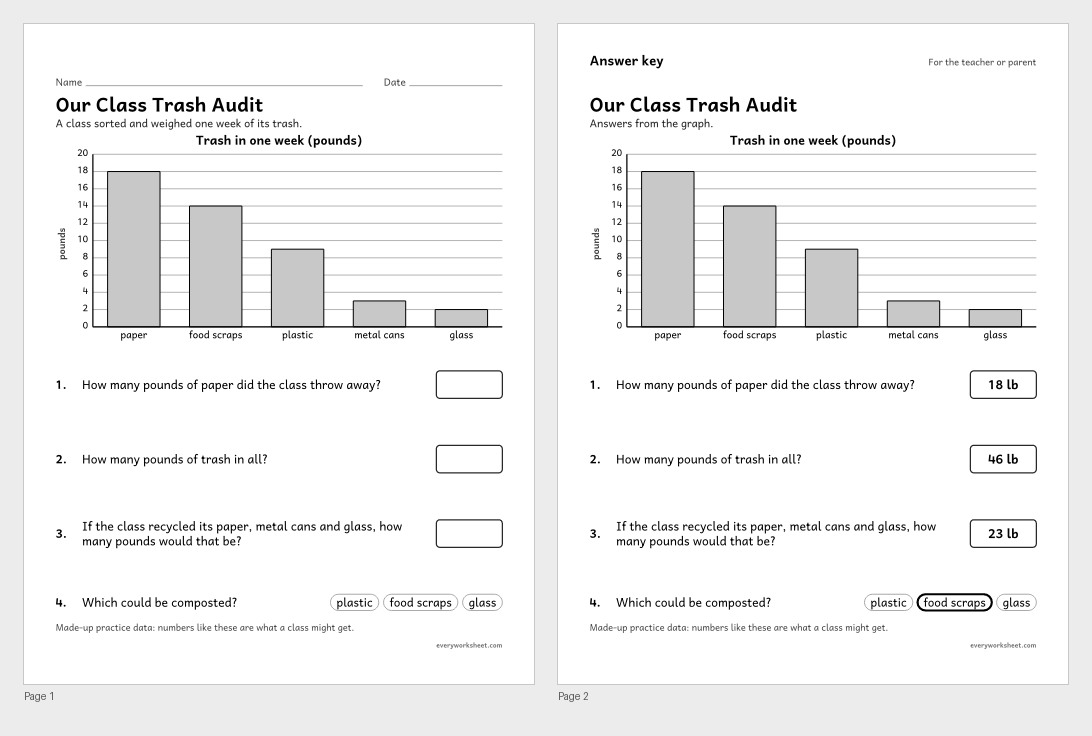 View all 2 pages
Analyzing trash data to find ways to reduce waste
Answer key on page 2
2 pages38 KB
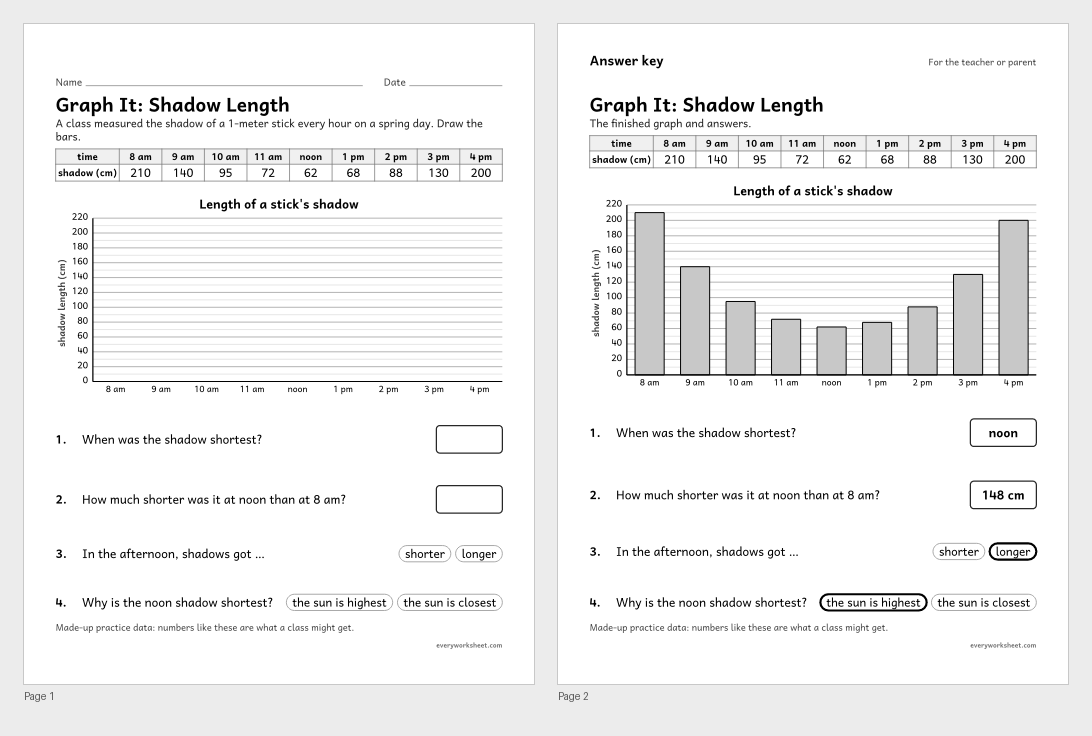 View all 2 pages
Graphing shadow lengths to find the daily pattern
Answer key on page 2
2 pages49 KB
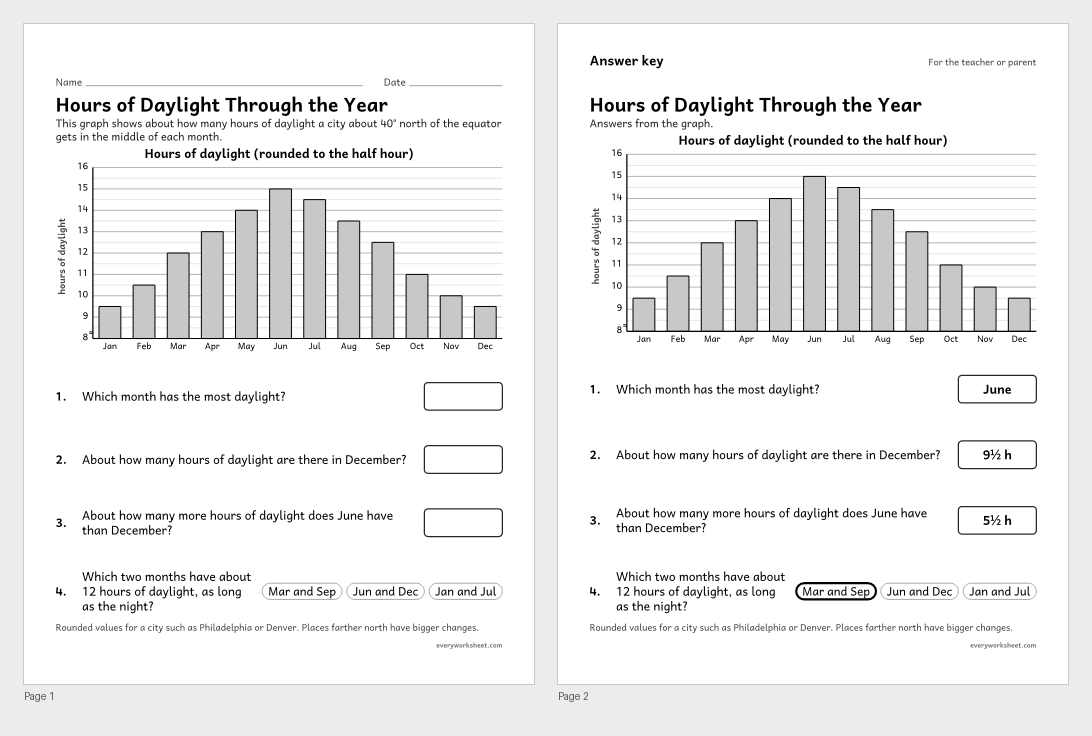 View all 2 pages
Reading a graph of day length to describe a seasonal pattern
Answer key on page 2
2 pages40 KB
Print at 100% (actual size) for the cleanest tracing lines.
A bar graph uses bars of different lengths to compare amounts. It answers questions like which is the most, which is the least and how many more.
Young children color one box for each thing they count. In 2nd grade they solve problems from a graph, and in 3rd grade each square can stand for 2, 5 or 10.
Holiday, science and social studies graphs give children real reasons to read data.
CCSS.MATH.CONTENT.K.MD.B.3Classify objects into given categories; count the numbers of objects in each category and sort the categories by count.CCSS.MATH.CONTENT.1.MD.C.4Organize, represent, and interpret data with up to three categories; ask and answer questions about the total number of data points, how many in each category, and how many more or less are in one category than in another.CCSS.MATH.CONTENT.2.MD.D.10Draw a picture graph and a bar graph (with single-unit scale) to represent a data set with up to four categories. Solve simple put-together, take-apart, and compare problems using information presented in a bar graph.CCSS.MATH.CONTENT.3.MD.B.3Draw a scaled picture graph and a scaled bar graph to represent a data set with several categories. Solve one- and two-step "how many more" and "how many less" problems using information presented in scaled bar graphs.On a scaled bar graph each square or grid line stands for more than one, such as 2, 5 or 10. Children count by the scale to read each bar. Scaled graphs start in 3rd grade.
A picture graph uses a picture for each thing (or each group of things). A bar graph uses a bar whose length shows the amount.