 View all 2 pages
Read a picture graph
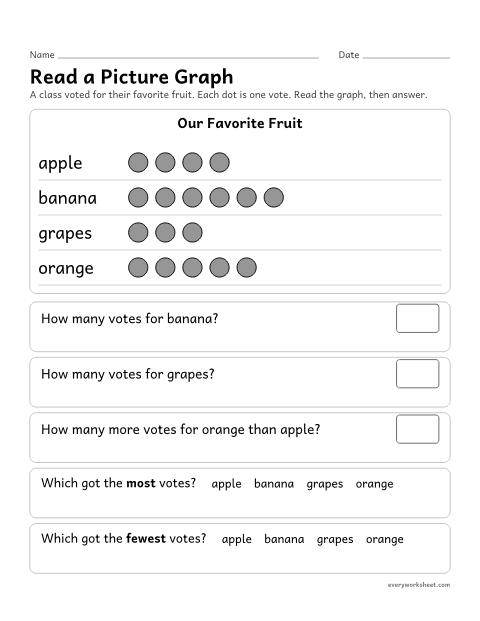
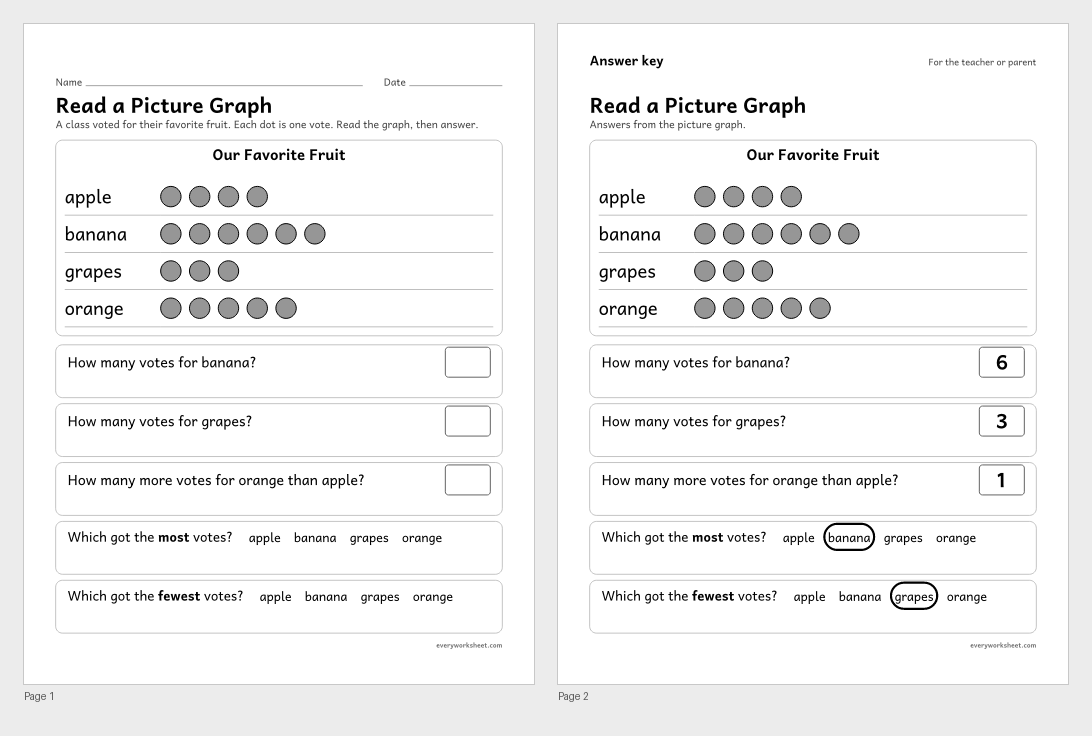
Reading a picture graph: how many, most and fewest
Answer key on page 2
2 pages38 KB
Read and make picture graphs from preschool to 2nd grade, then scaled picture graphs in 3rd grade where one picture stands for more than one.
View all 2 pagesReading a picture graph: how many, most and fewest
Answer key on page 2
2 pages38 KB
 View all 2 pages
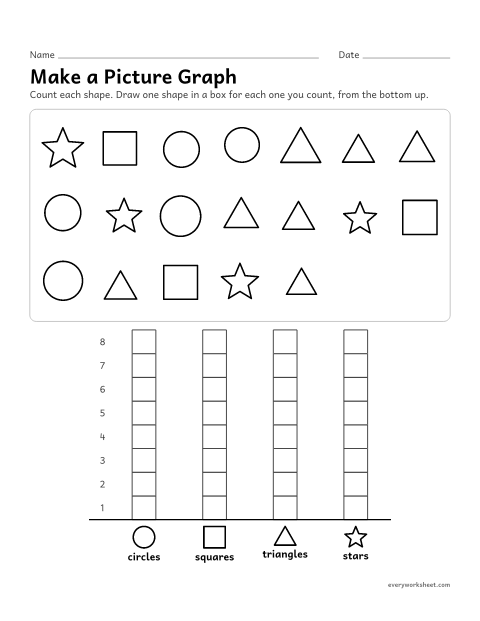
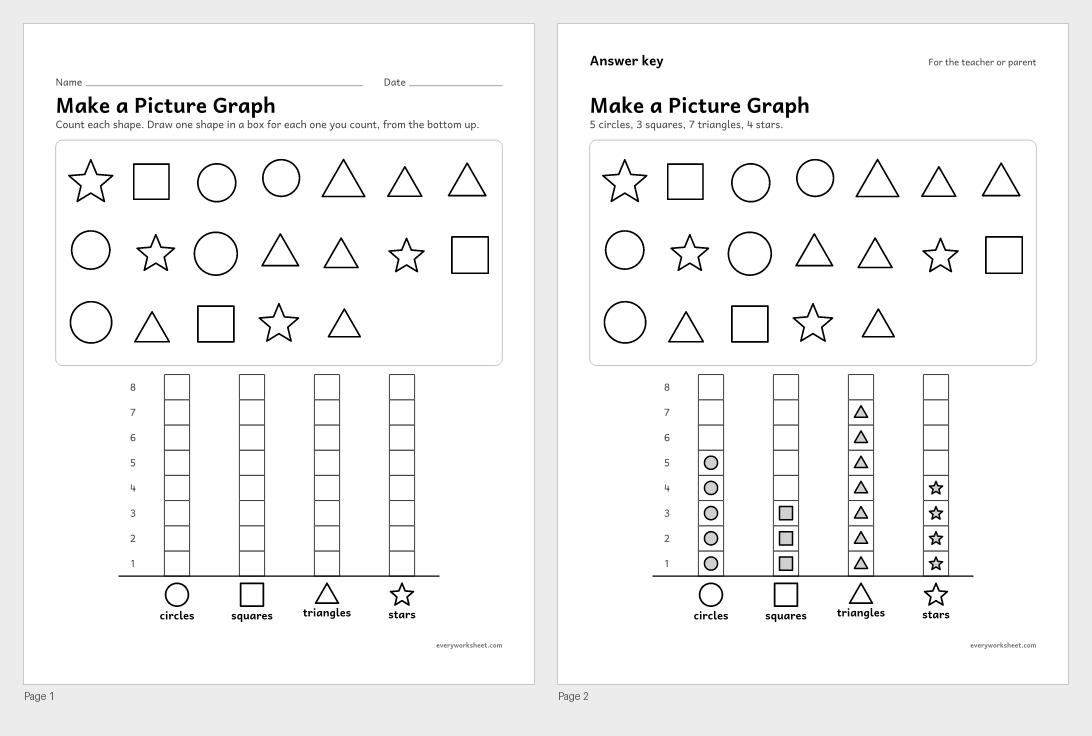
Counting groups and showing them in a picture graph
Answer key on page 2
2 pages40 KB
 View larger
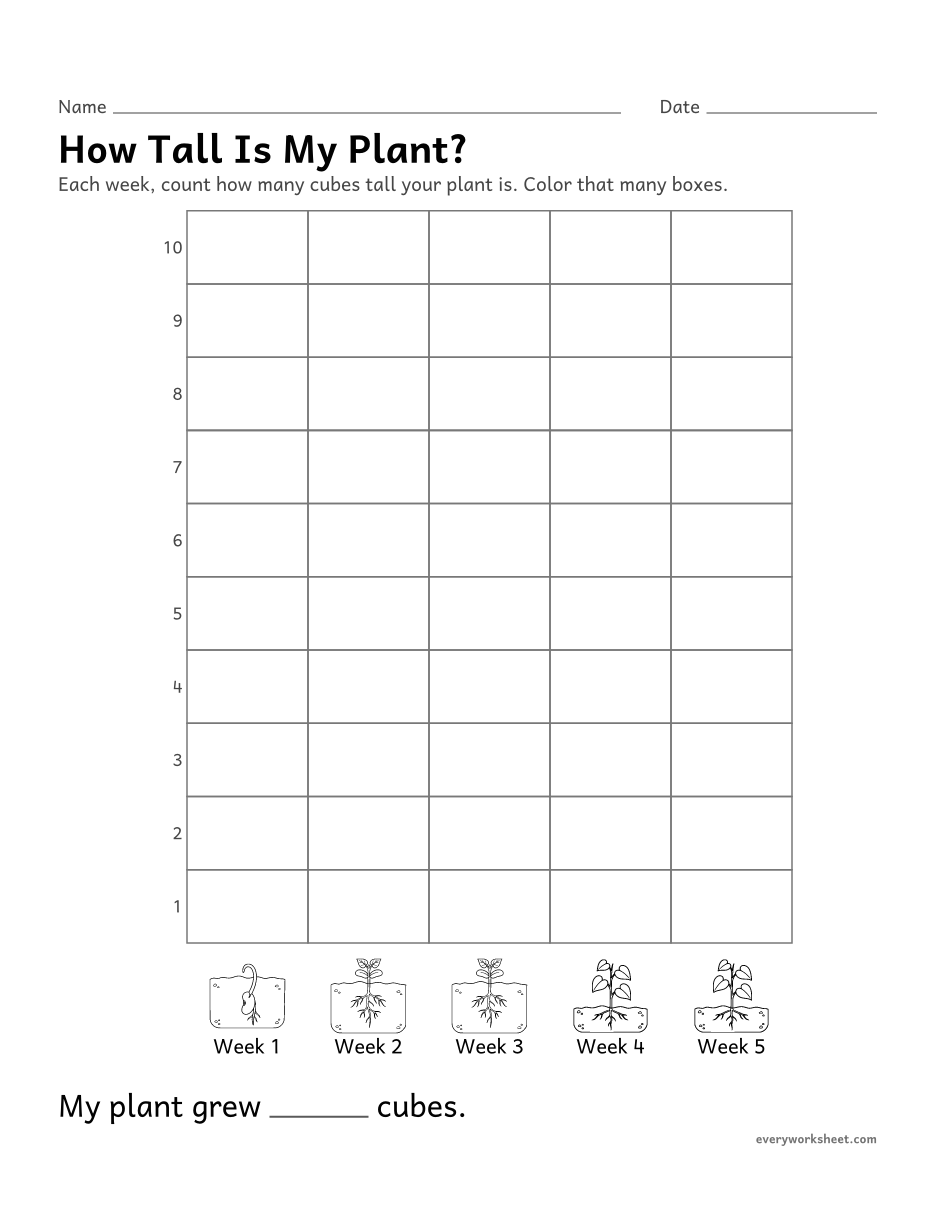
Measuring a plant with cubes and graphing its height over time
1 page53 KB
 View larger
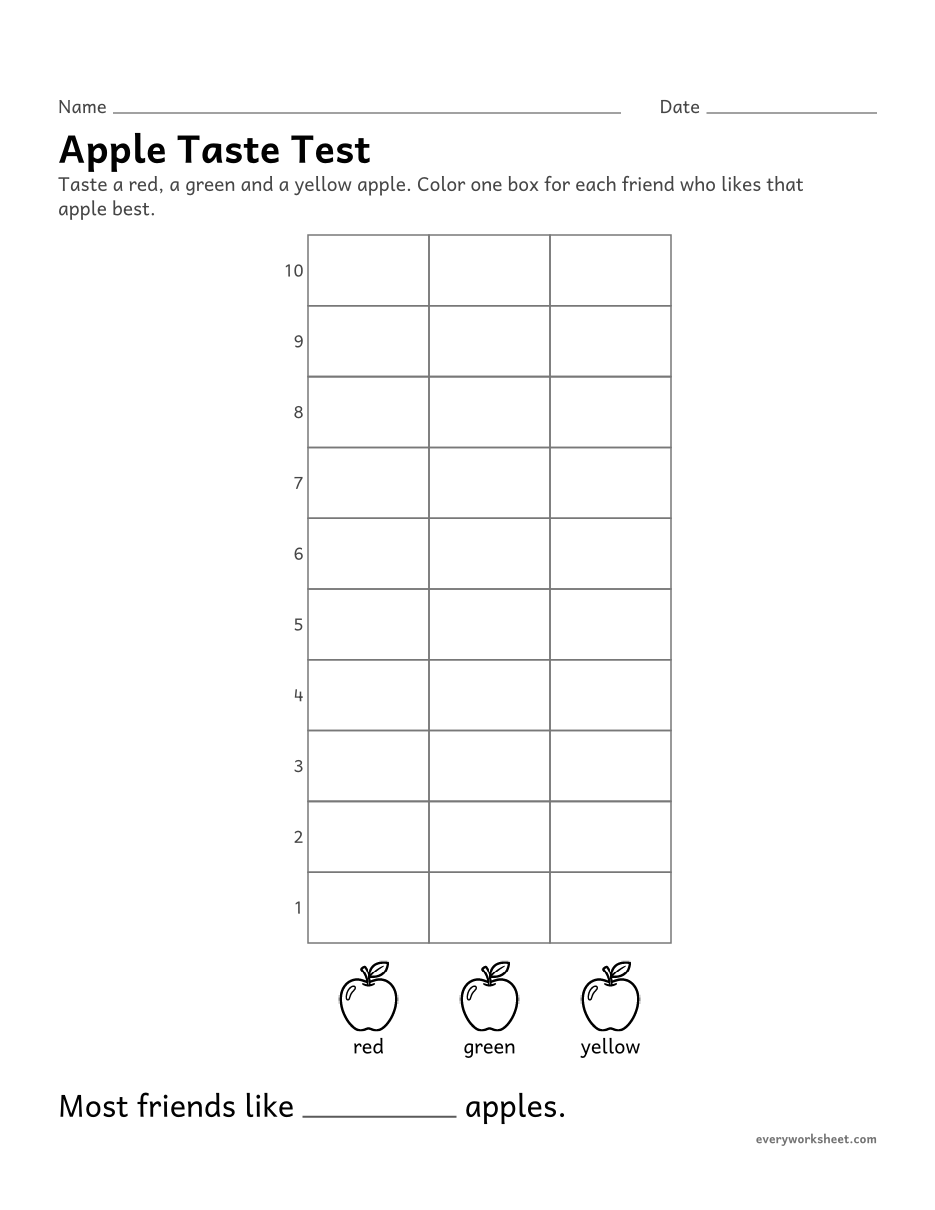
Graphing class votes and comparing which group has more
1 page76 KB
 View all 2 pages
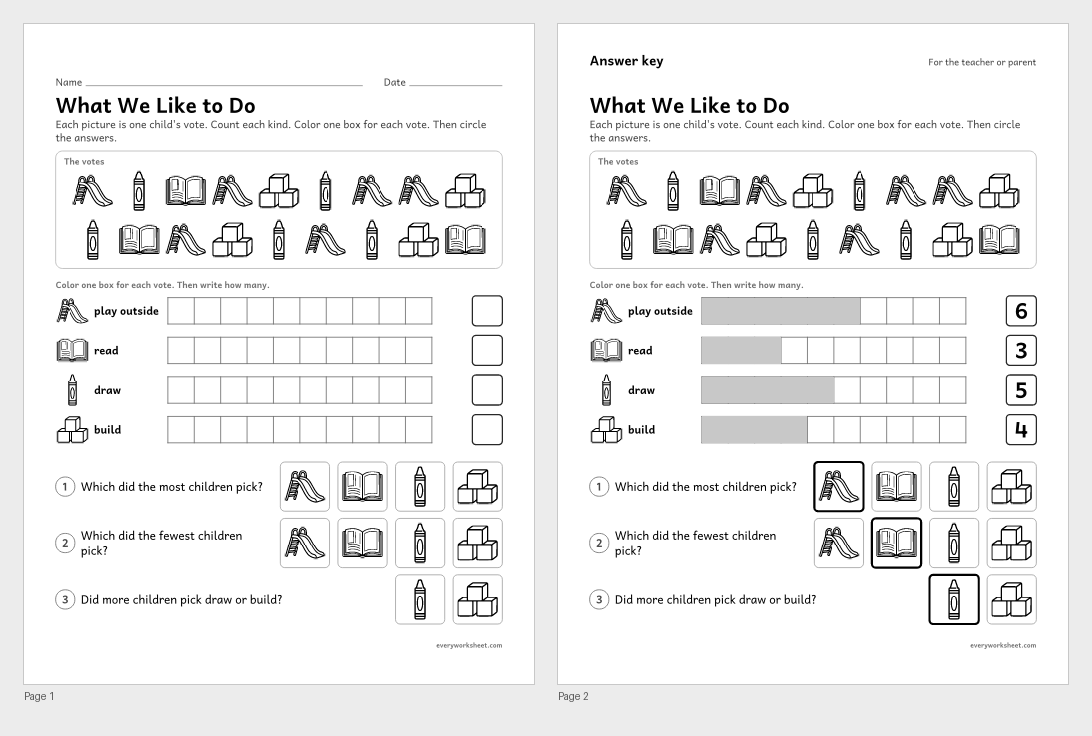
Counting a class's votes, making a picture graph and comparing the counts
Answer key on page 2
2 pages908 KB
 View all 2 pages
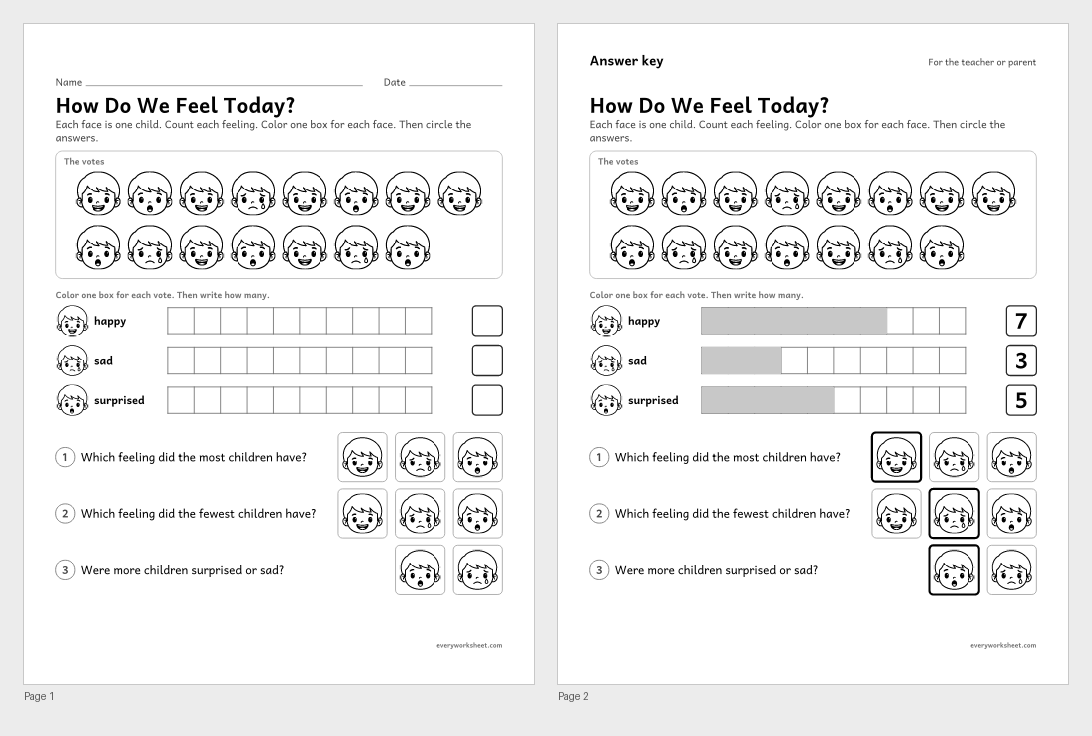
Counting feelings in a class, making a picture graph and comparing the counts
Answer key on page 2
2 pages1.1 MB
 View all 2 pages
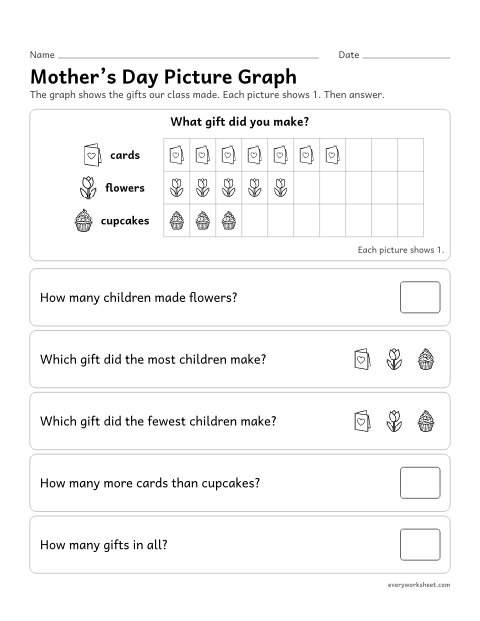
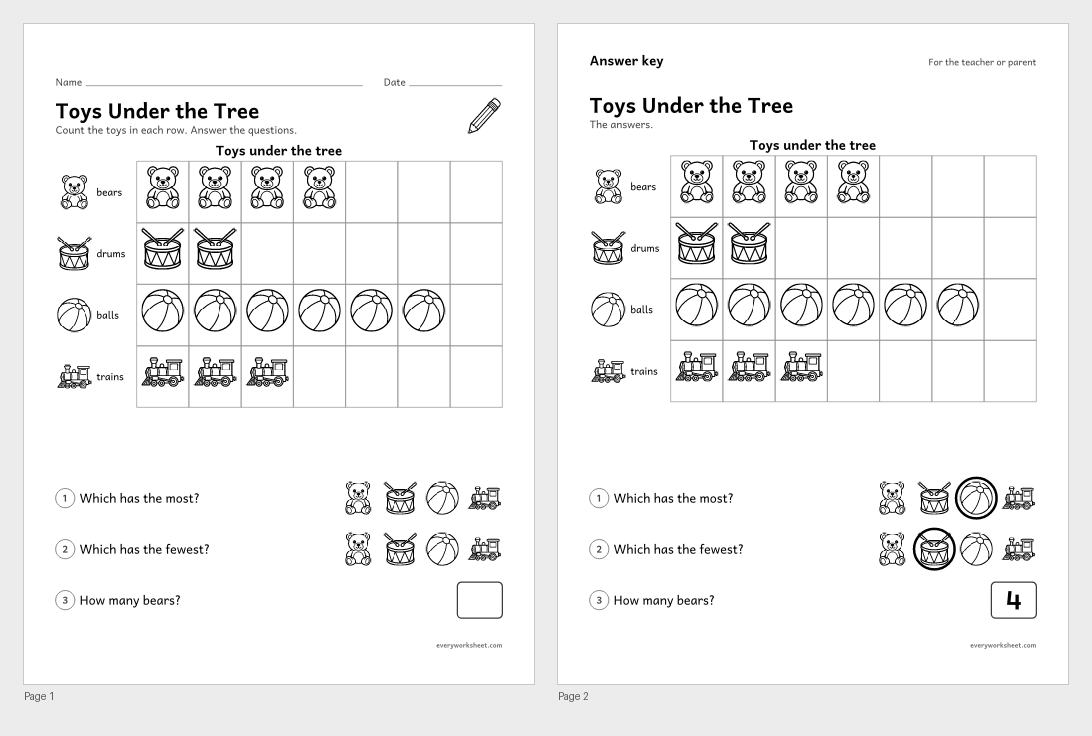
Counting and comparing groups in a picture graph
Answer key on page 2
2 pages1.0 MB
 View all 2 pages
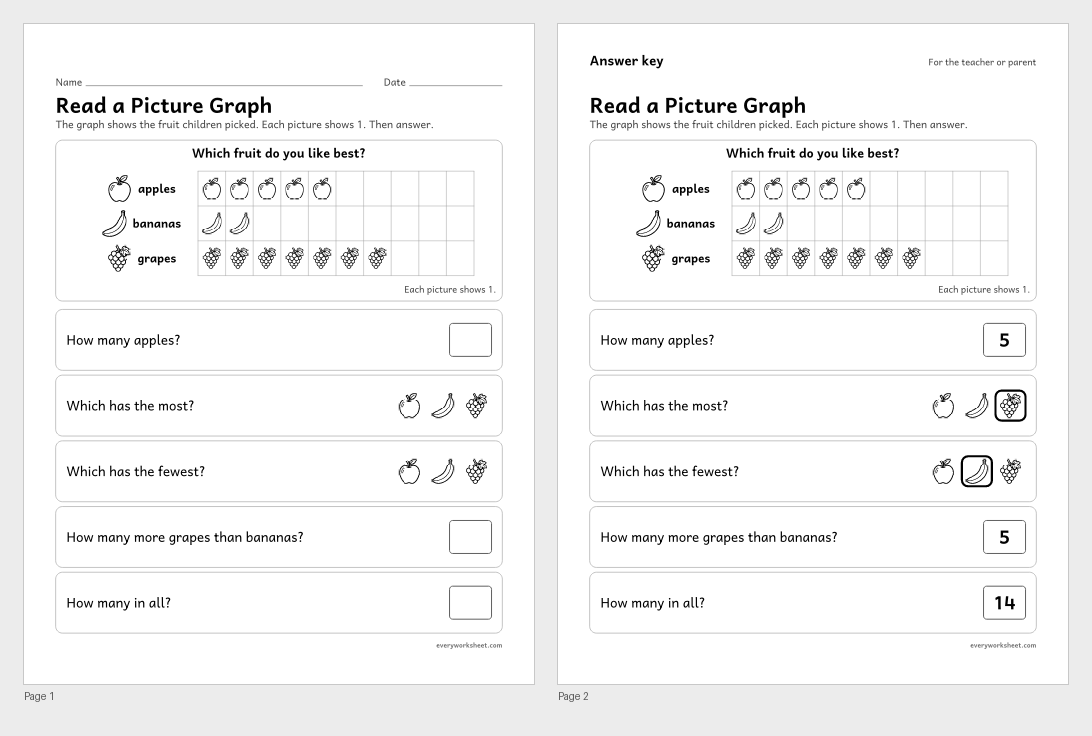
Reading a picture graph with three categories
Answer key on page 2
2 pages944 KB
 View all 2 pages
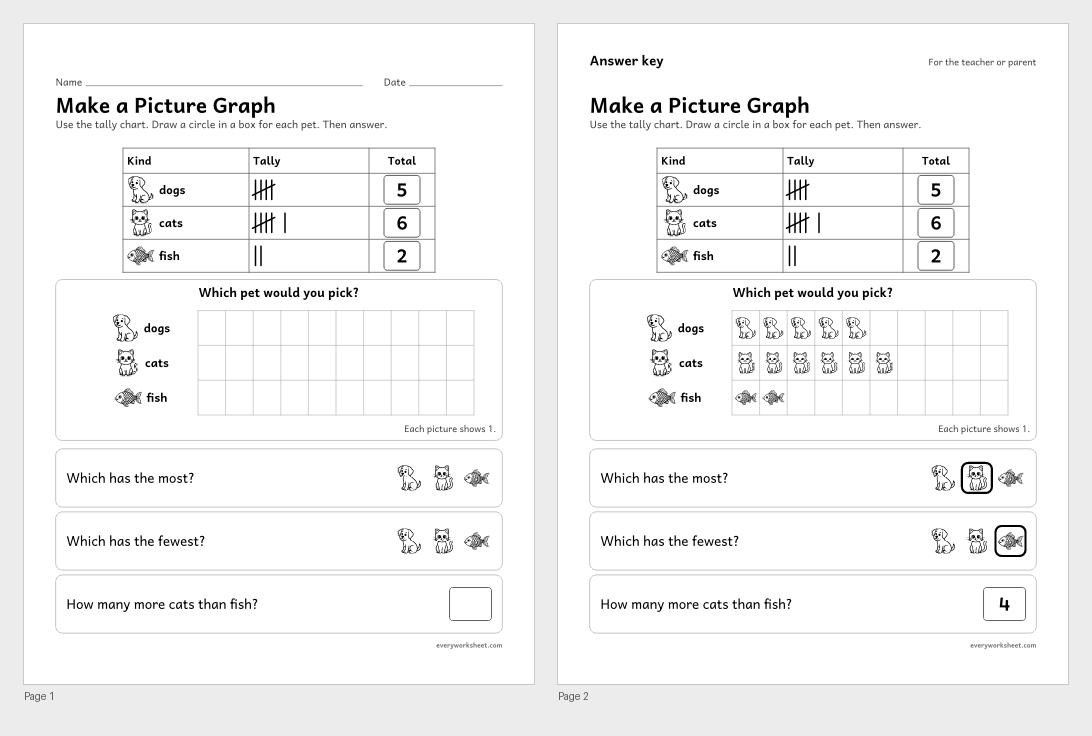
Making a picture graph from a tally chart
Answer key on page 2
2 pages672 KB
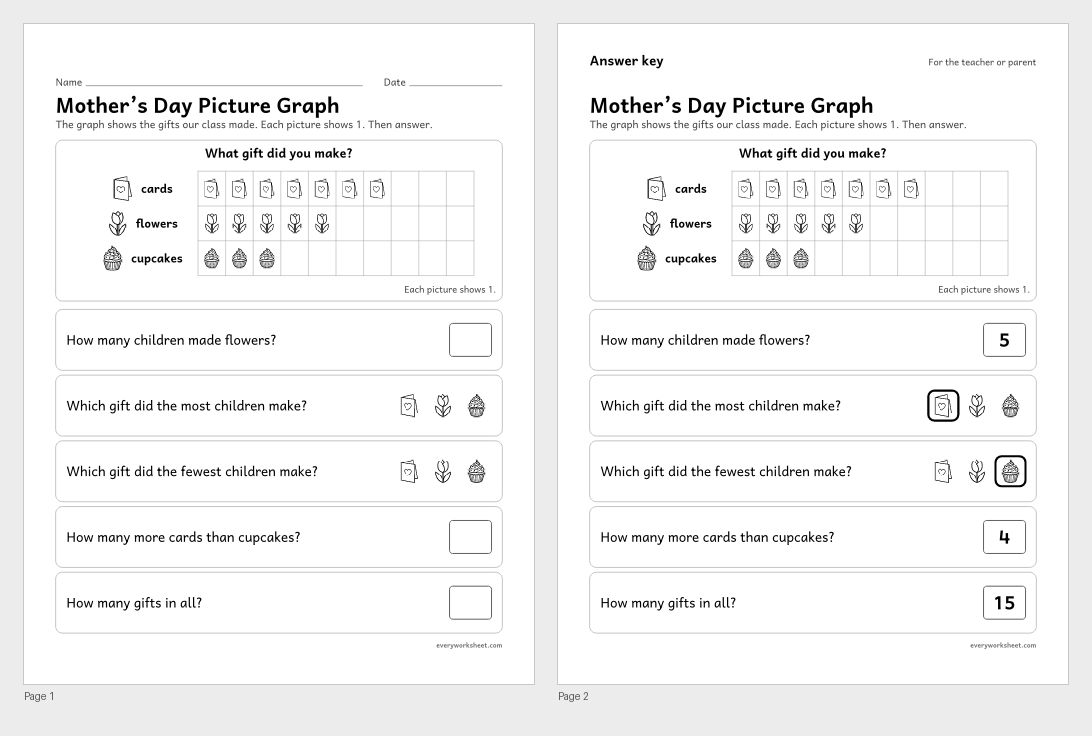 View all 2 pages
Reading a picture graph and comparing the groups
Answer key on page 2
2 pages741 KB
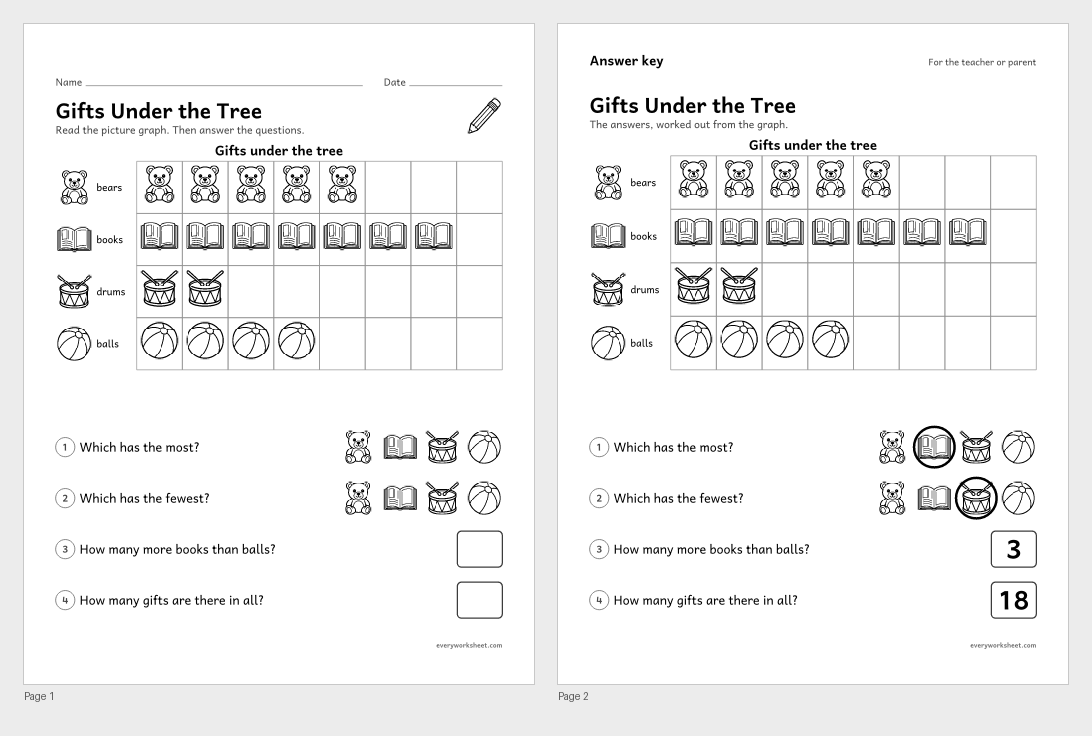 View all 2 pages
Reading a picture graph and comparing how many
Answer key on page 2
2 pages1.1 MB
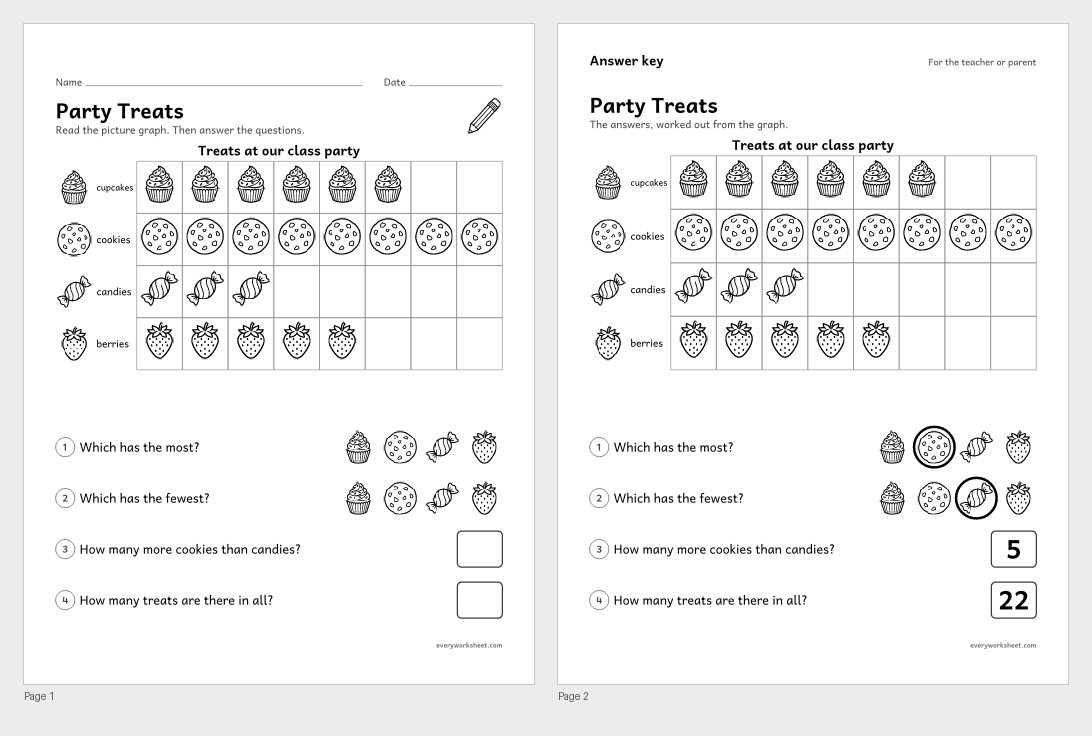 View all 2 pages
Reading a picture graph and comparing how many
Answer key on page 2
2 pages1.6 MB
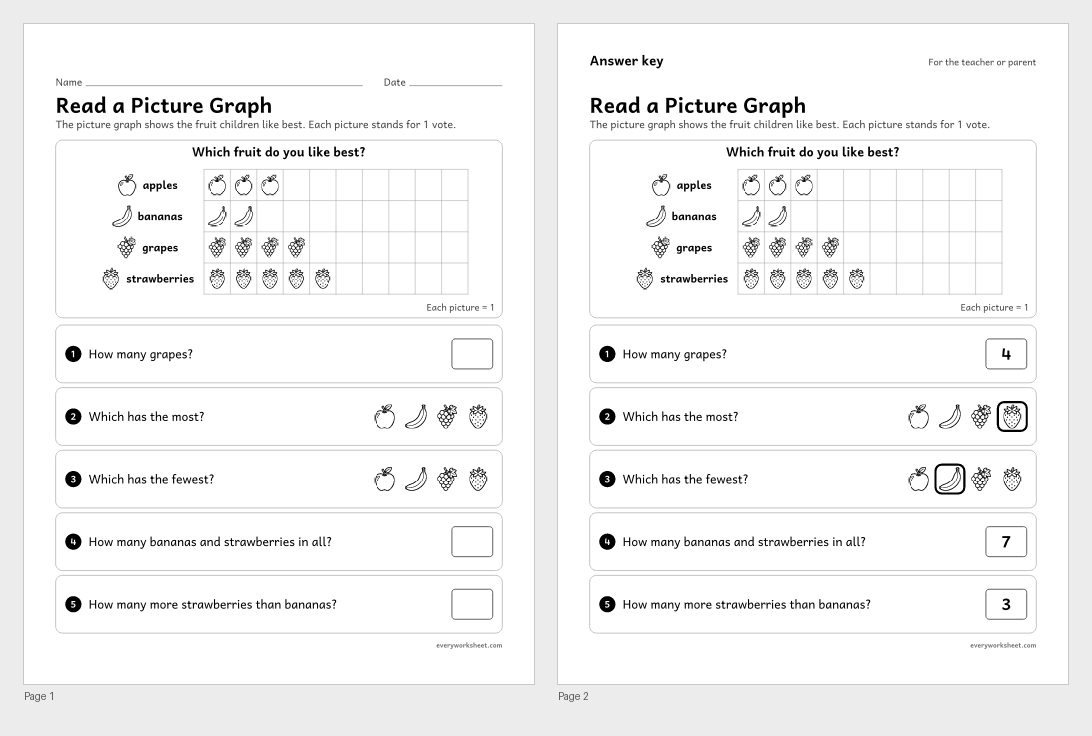 View all 2 pages
Reading a picture graph with four categories: how many, put together and compare
Answer key on page 2
2 pages1.0 MB
 View all 2 pages
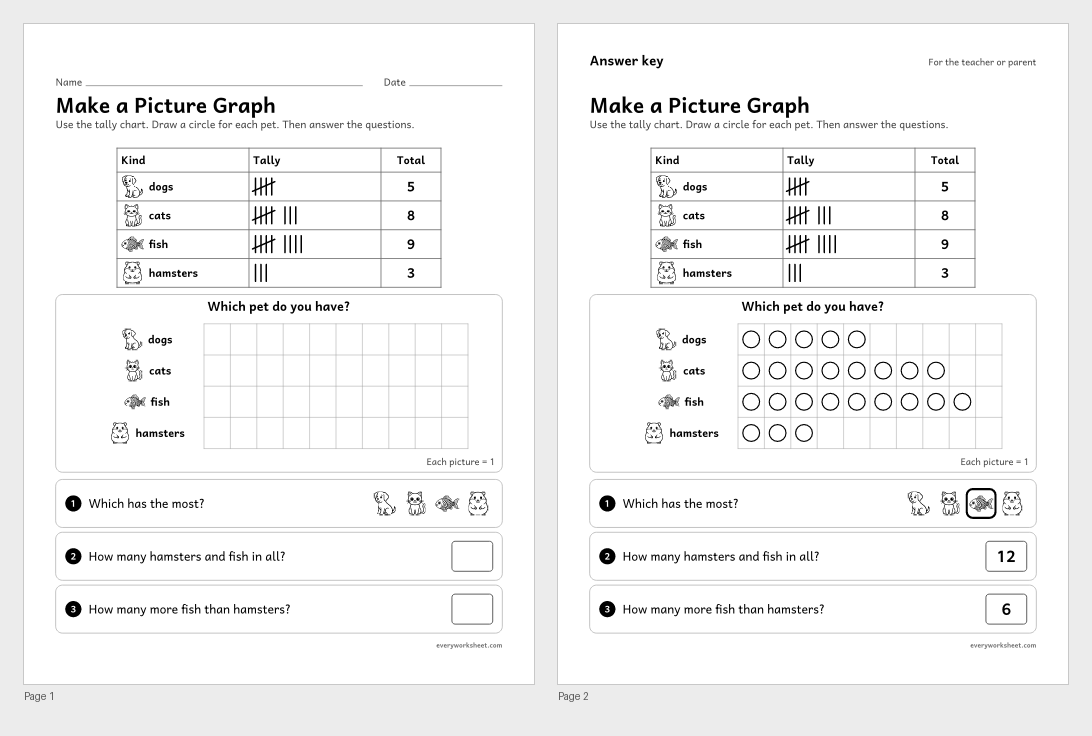
Drawing a picture graph from a tally chart with four categories
Answer key on page 2
2 pages520 KB
 View all 2 pages
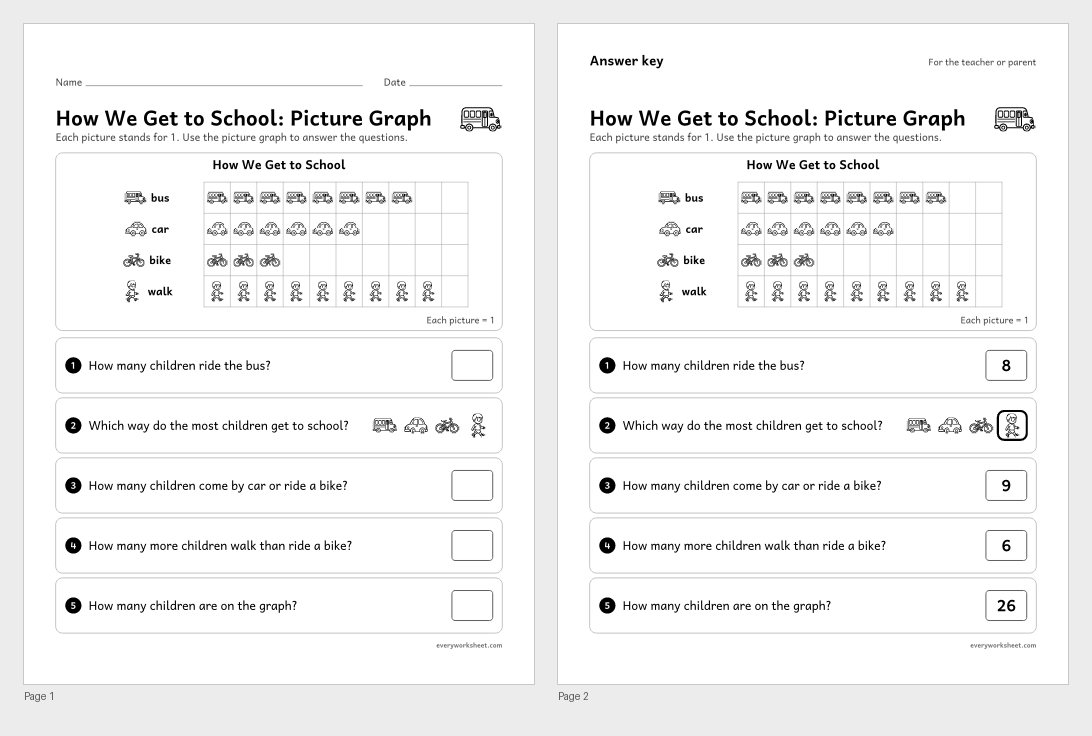
Reading a picture graph with four categories and solving put-together and compare problems
Answer key on page 2
2 pages880 KB
 View all 2 pages
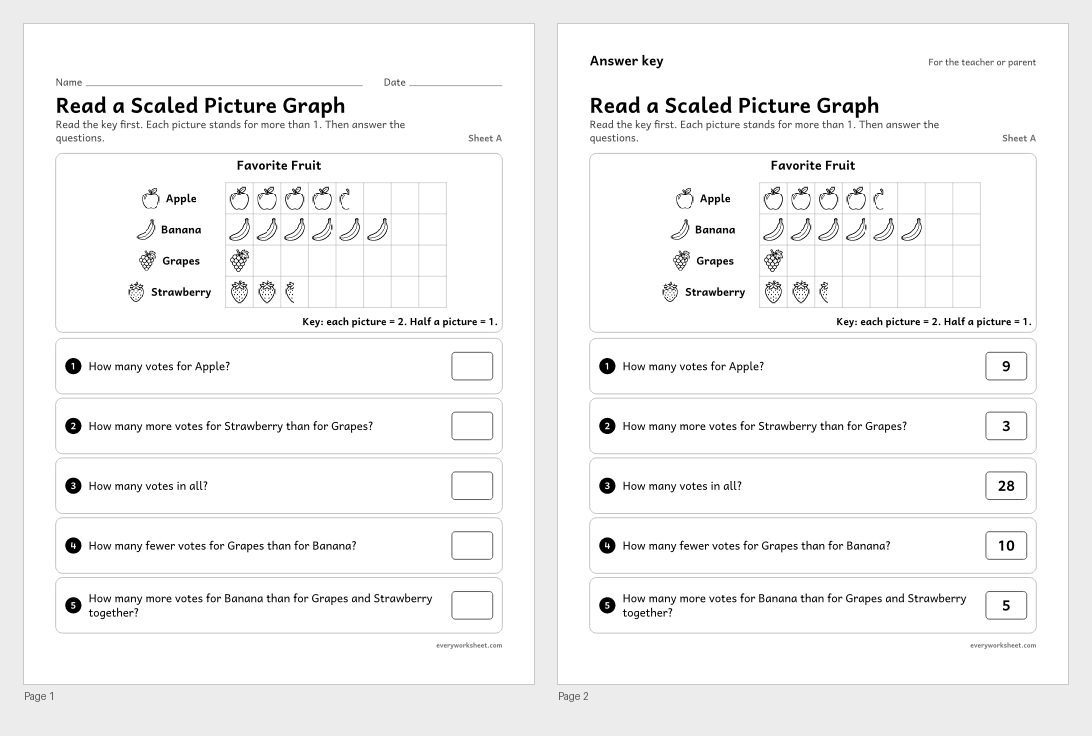
Reading a picture graph where each picture stands for 2 and half a picture for 1
Answer key on page 2
2 pages708 KB
 View all 2 pages
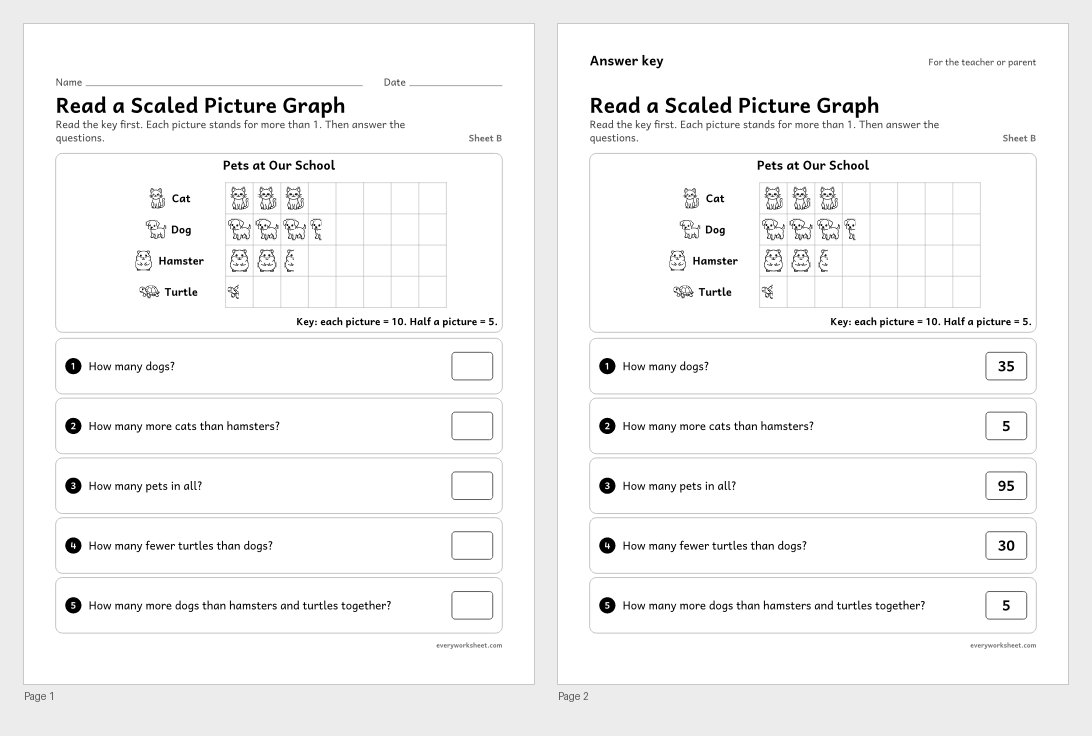
Reading a picture graph where each picture stands for 10 and half a picture for 5
Answer key on page 2
2 pages729 KB
 View all 2 pages
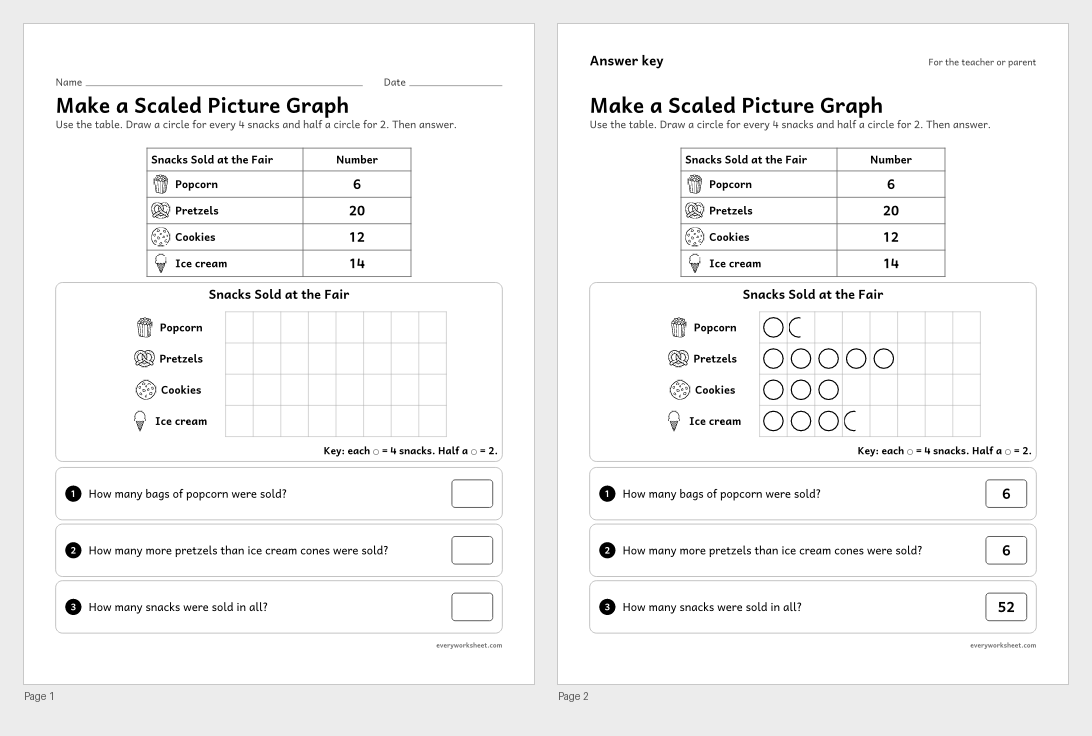
Drawing a picture graph from a table where each picture stands for 4
Answer key on page 2
2 pages394 KB
Print at 100% (actual size) for the cleanest tracing lines.
A picture graph, also called a pictograph, uses small pictures to show how many. It is often the first graph children make, because each picture is one thing they counted.
In 3rd grade, picture graphs get a key: one picture can stand for 2, 5 or 10, and half a picture stands for half as many.
The sheets are grouped by grade below.
CCSS.MATH.CONTENT.K.MD.B.3Classify objects into given categories; count the numbers of objects in each category and sort the categories by count.CCSS.MATH.CONTENT.1.MD.C.4Organize, represent, and interpret data with up to three categories; ask and answer questions about the total number of data points, how many in each category, and how many more or less are in one category than in another.CCSS.MATH.CONTENT.2.MD.D.10Draw a picture graph and a bar graph (with single-unit scale) to represent a data set with up to four categories. Solve simple put-together, take-apart, and compare problems using information presented in a bar graph.CCSS.MATH.CONTENT.3.MD.B.3Draw a scaled picture graph and a scaled bar graph to represent a data set with several categories. Solve one- and two-step "how many more" and "how many less" problems using information presented in scaled bar graphs.A pictograph is another name for a picture graph: a graph that uses pictures to show amounts.
The key tells how many each picture stands for. If one apple stands for 2 children, a row of 4 apples means 8 children.