 View larger
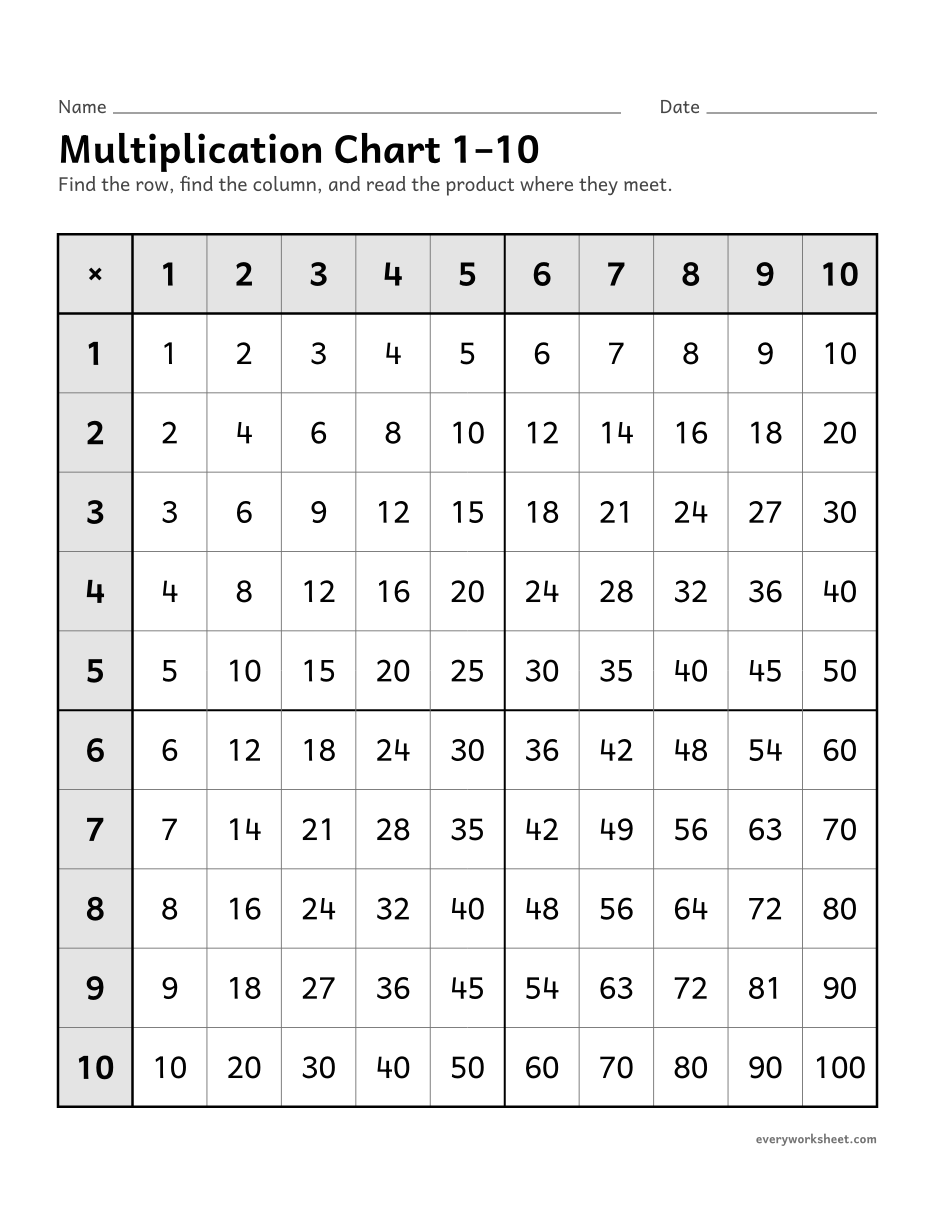
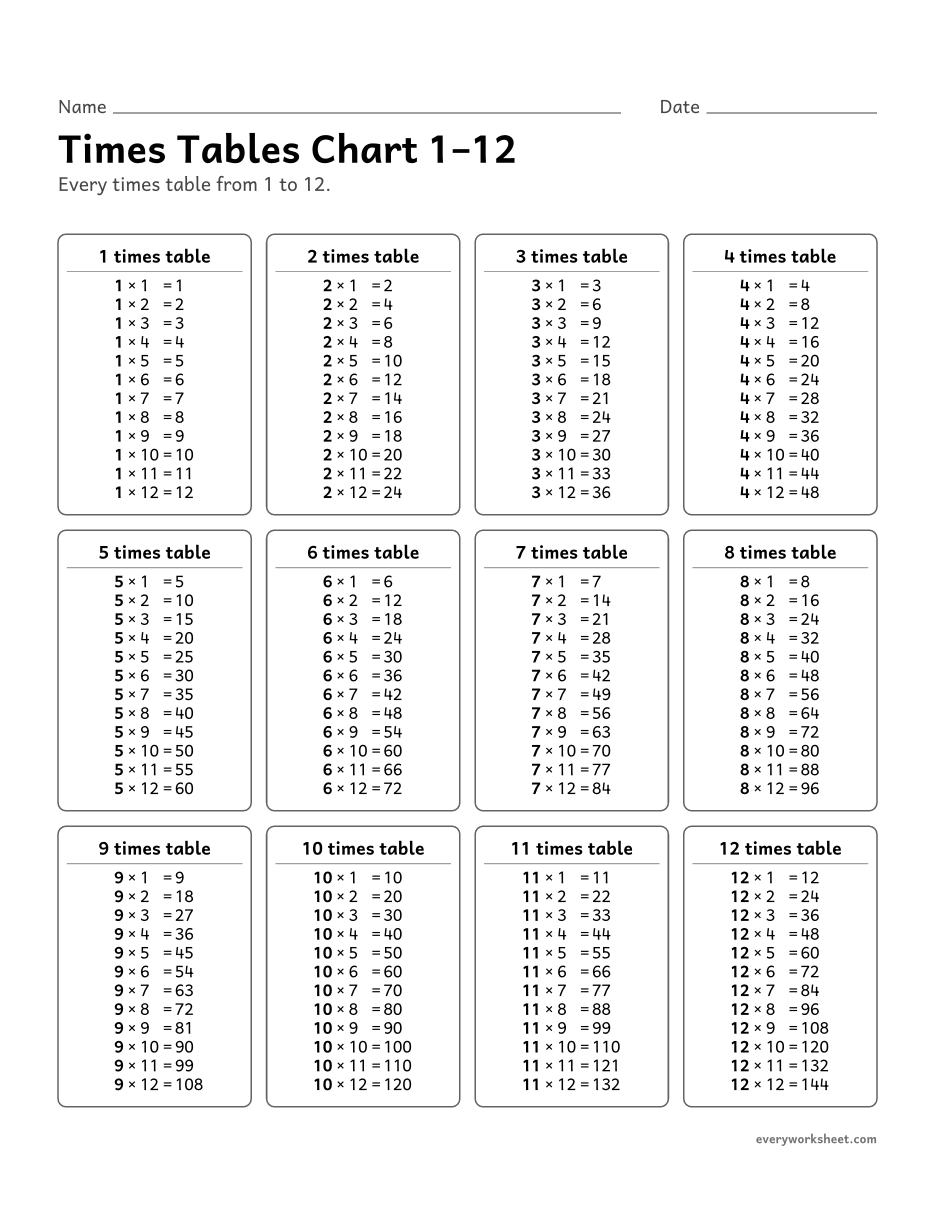
Multiplication chart 1–12
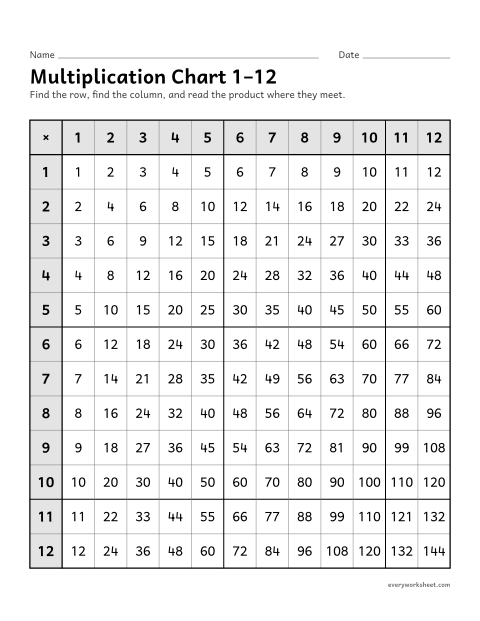
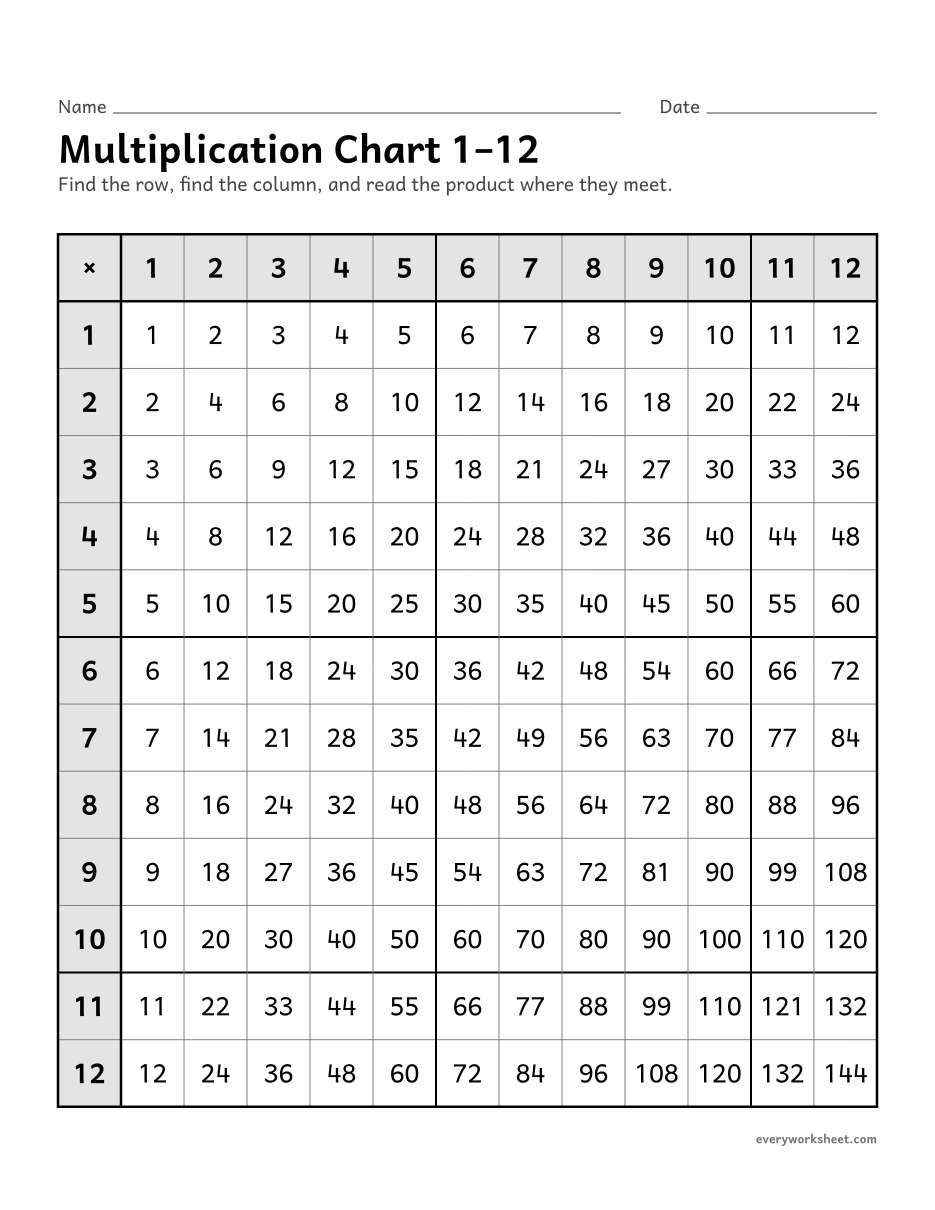
Reading products on a 1 to 12 multiplication chart
1 page30 KB
Clean printable multiplication charts from 1–10 to 1–20, blank and partly filled charts with answer keys, times tables lists, a hundred chart and pattern pages.
View largerReading products on a 1 to 12 multiplication chart
1 page30 KB
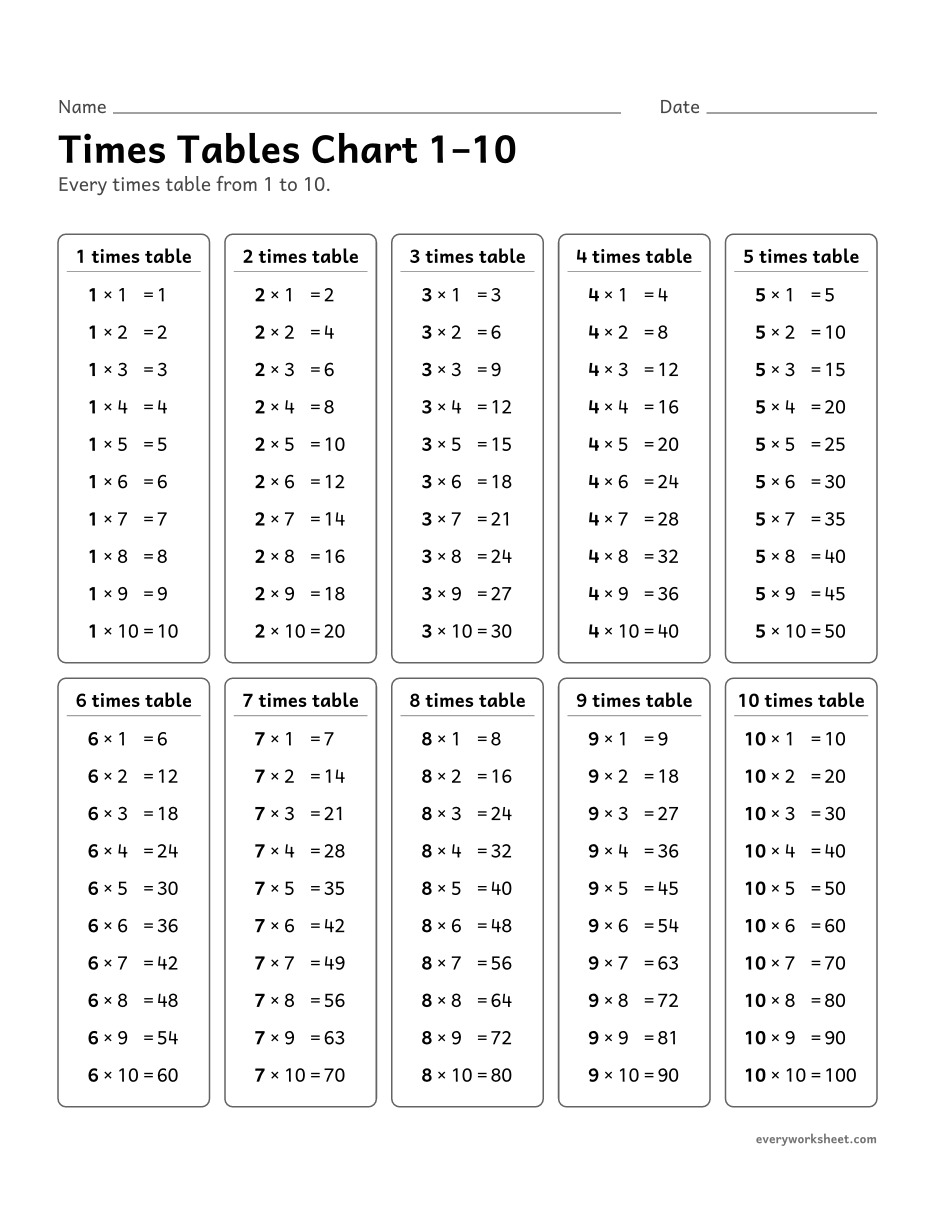
 View larger
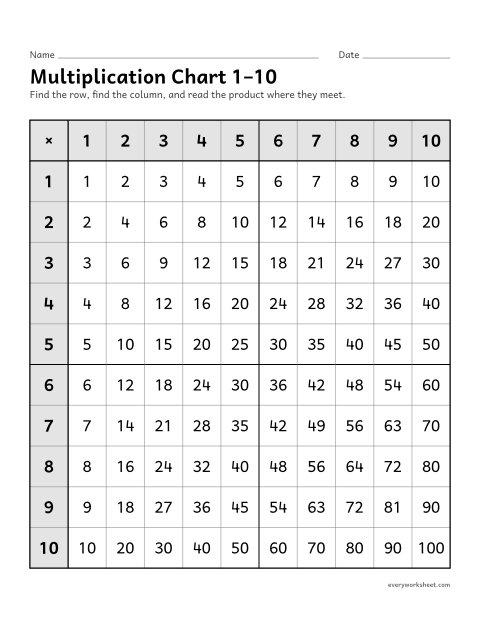
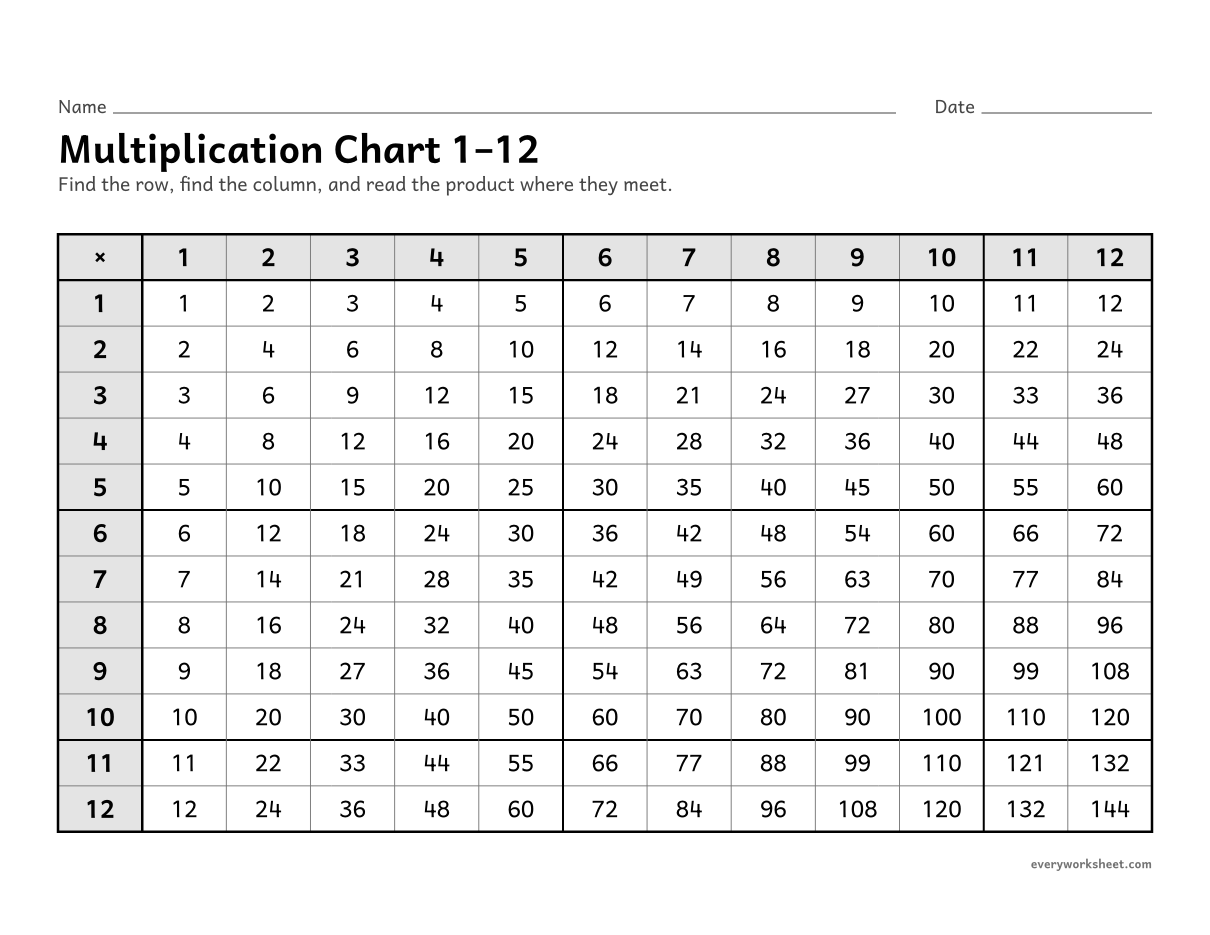
Reading products on a 1 to 10 multiplication chart
1 page29 KB
 View larger
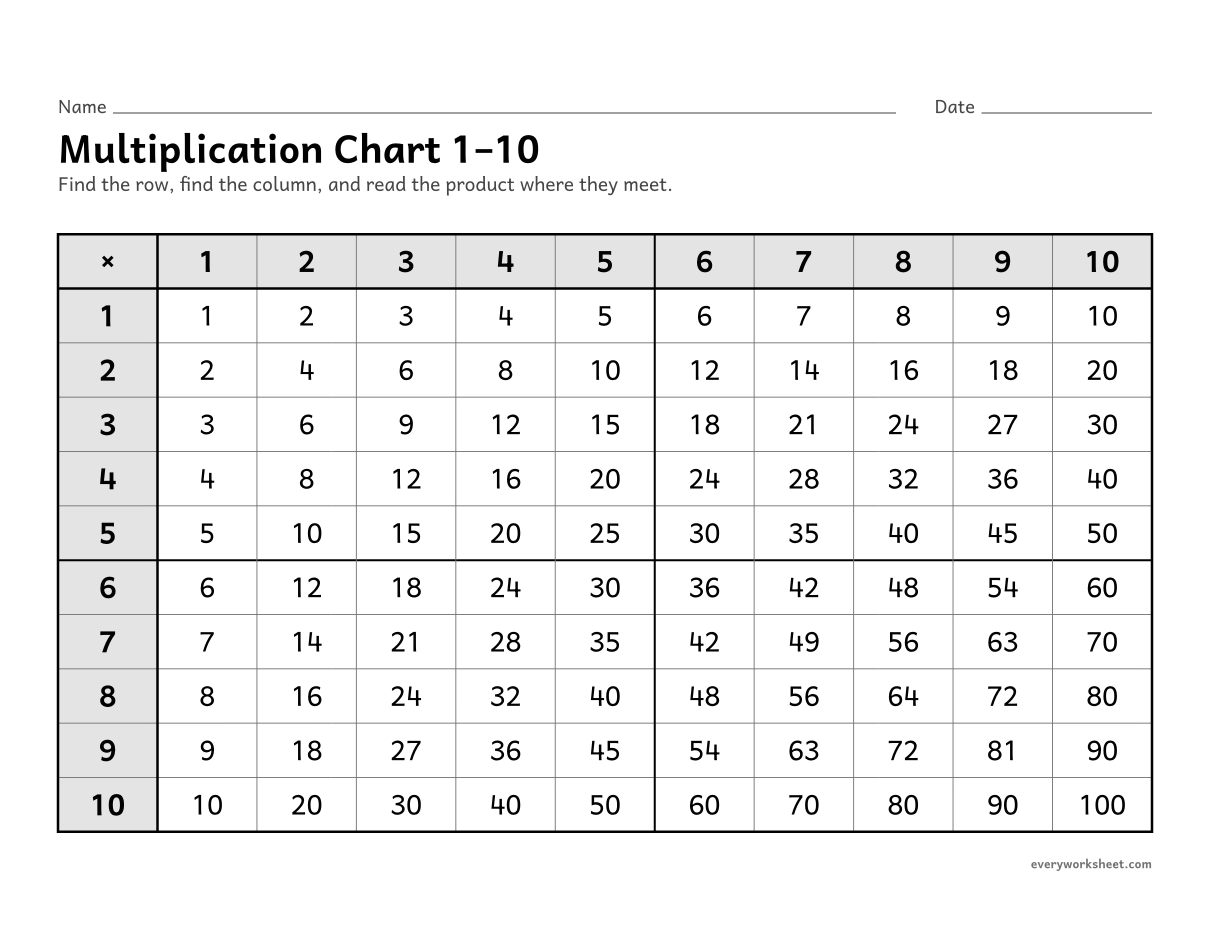
Reading products on a 1 to 12 multiplication chart (landscape)
1 page30 KB
 View larger
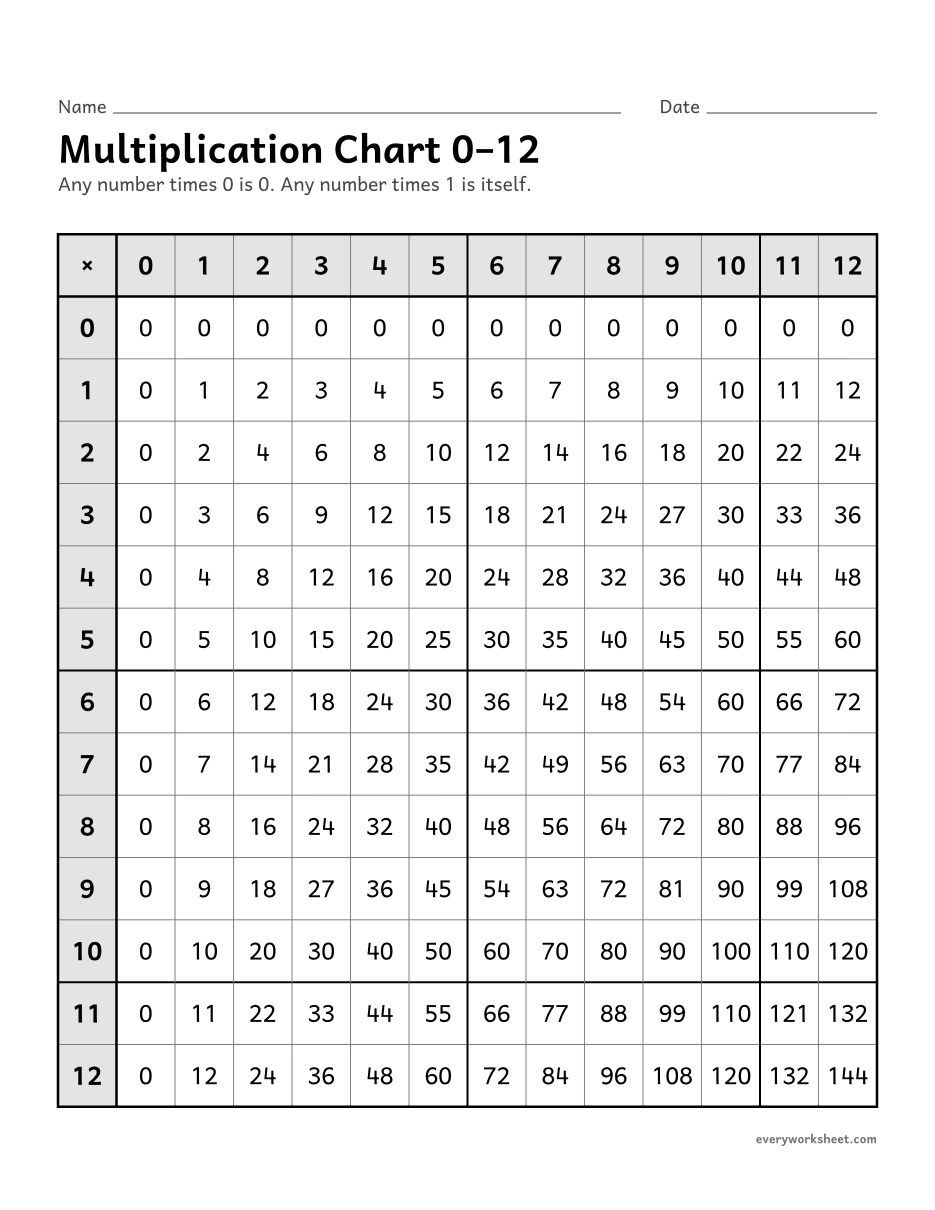
Reading products on a 1 to 10 multiplication chart (landscape)
1 page29 KB
 View larger
Reading products on a 0 to 12 multiplication chart
1 page30 KB
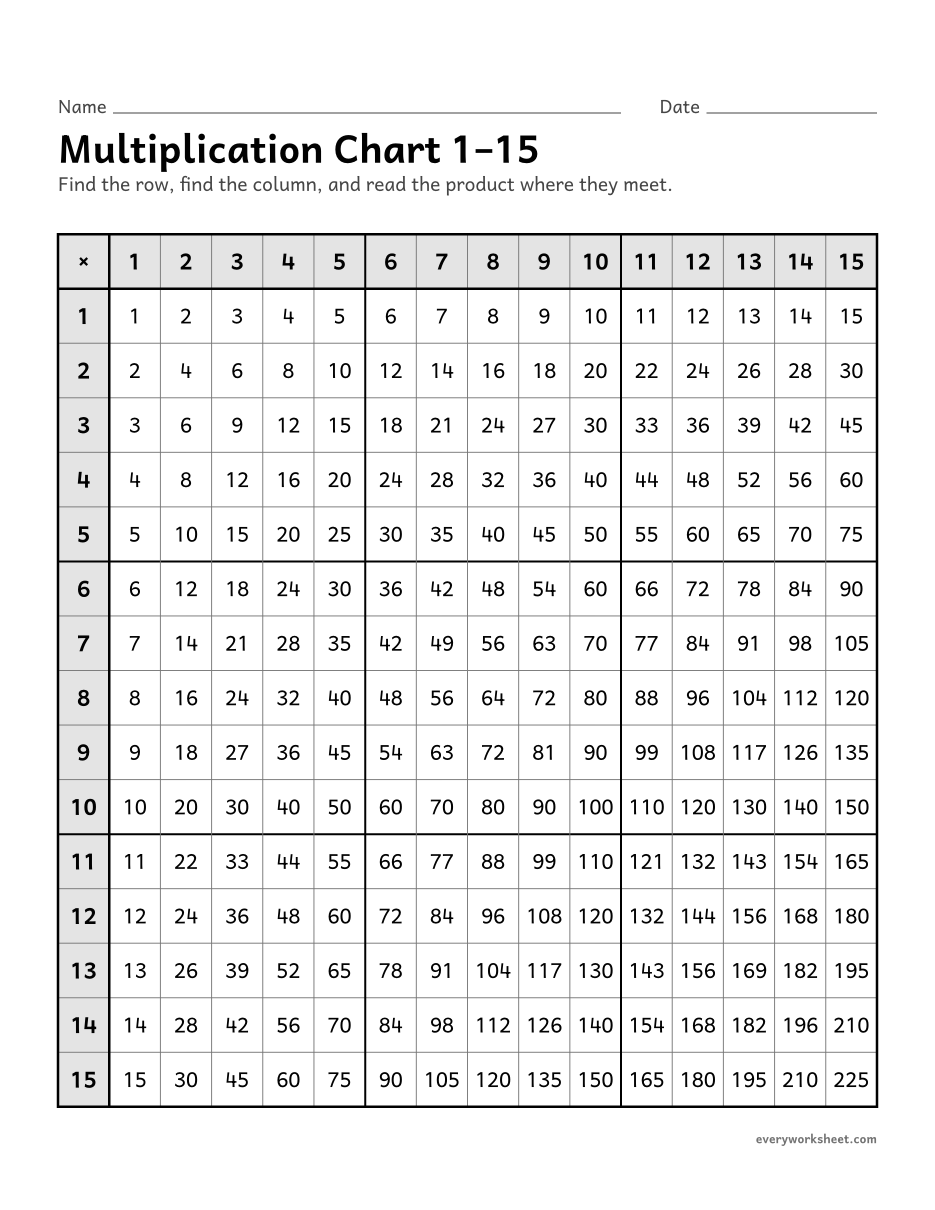 View larger
Reading products on a 1 to 15 multiplication chart
1 page32 KB
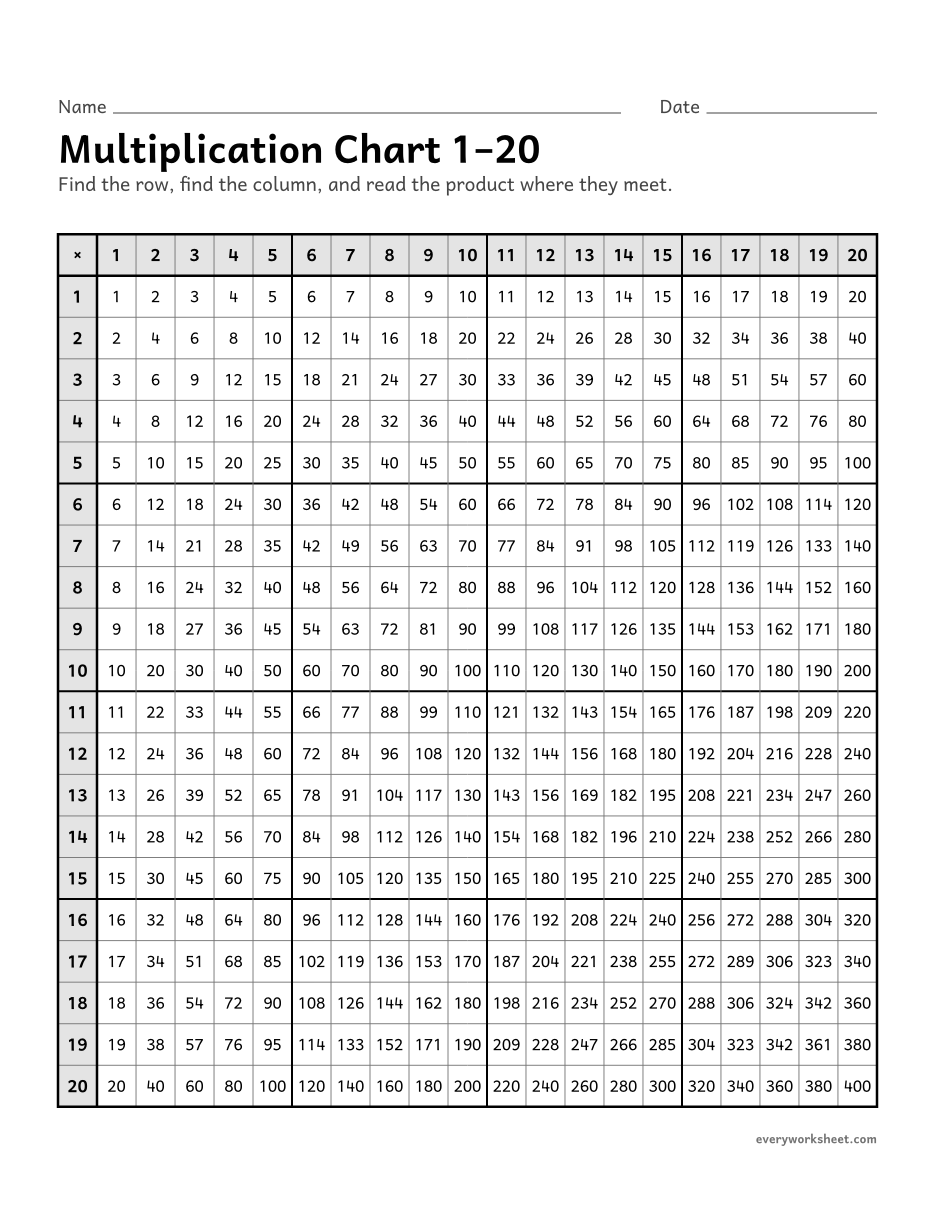 View larger
Reading products on a 1 to 20 multiplication chart
1 page35 KB
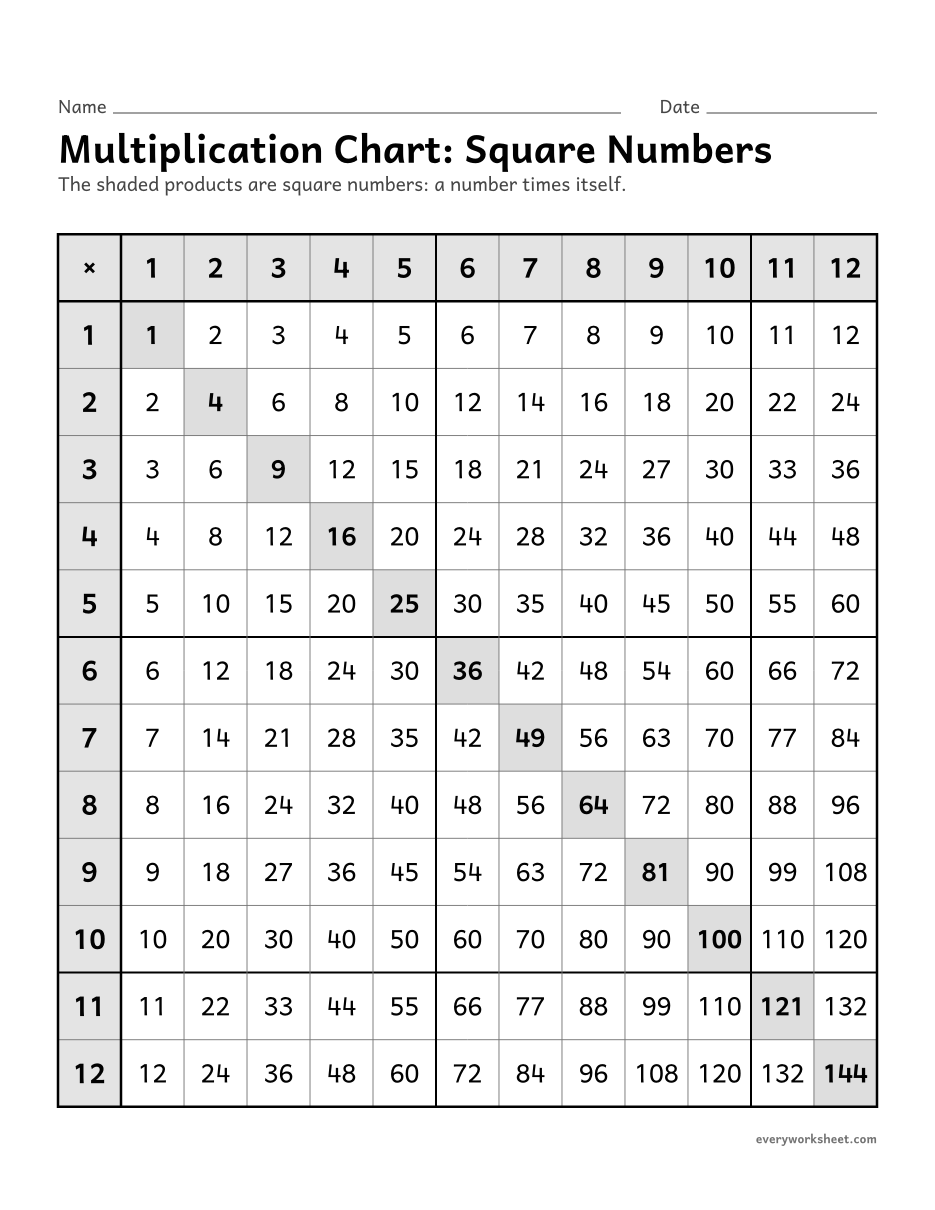 View larger
Square numbers on the multiplication chart
1 page31 KB
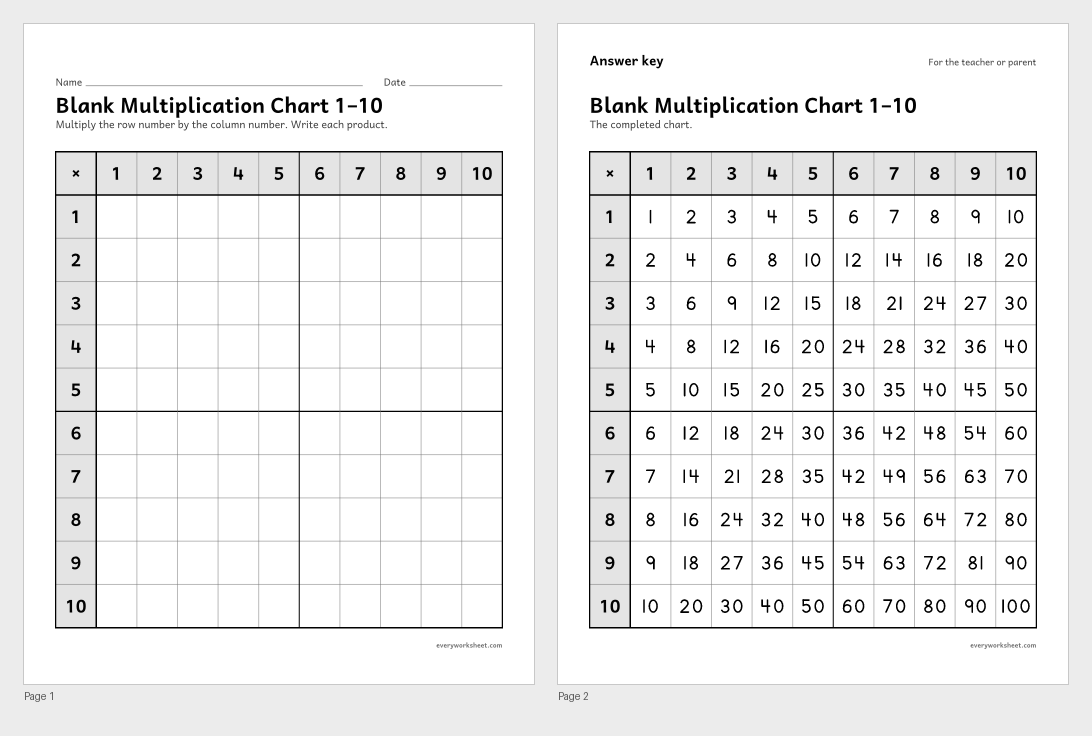 View all 2 pages
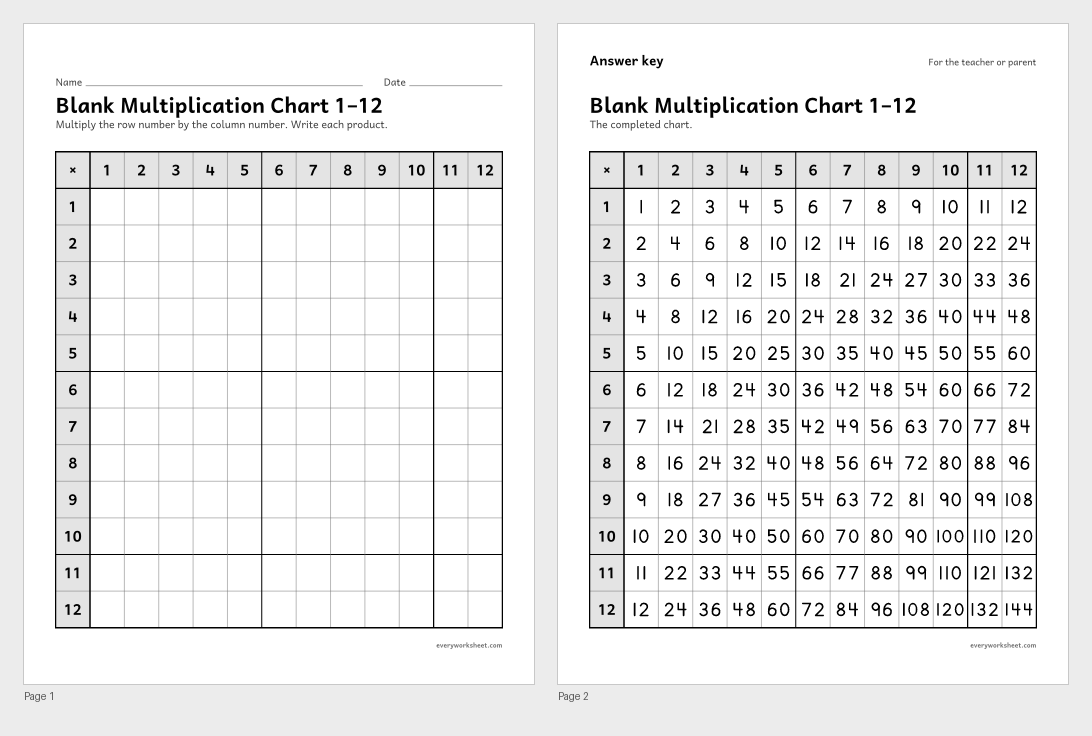
Filling in a blank 1 to 10 multiplication chart
Answer key on page 2
2 pages32 KB
 View all 2 pages
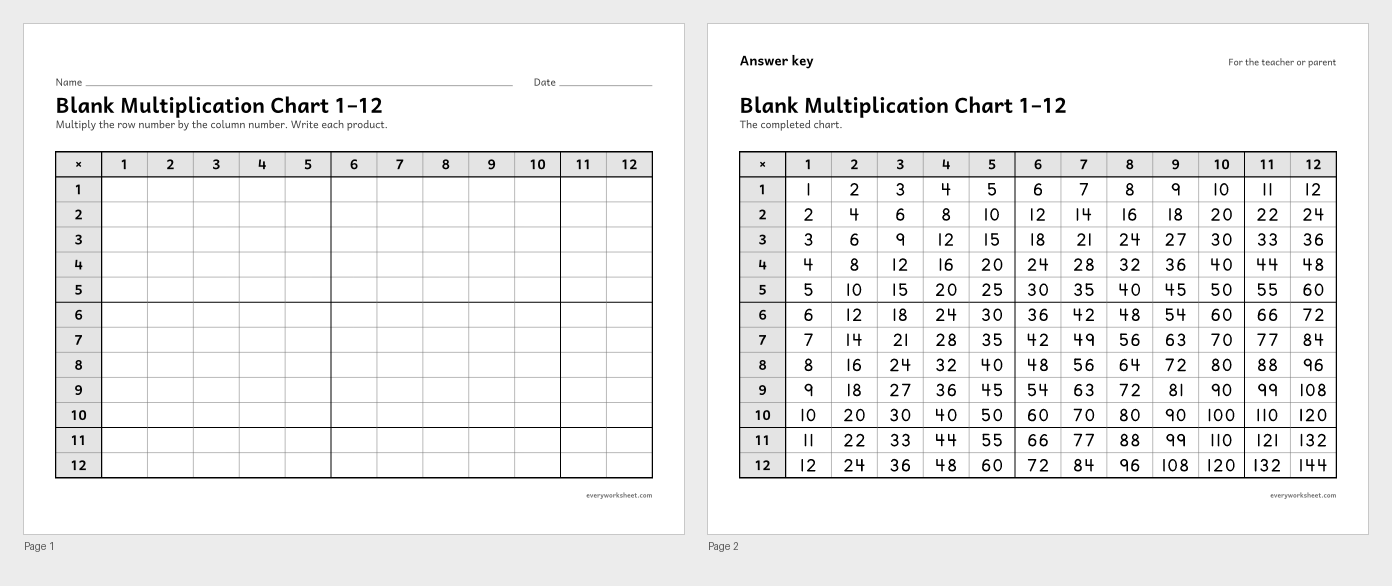
Filling in a blank 1 to 12 multiplication chart
Answer key on page 2
2 pages34 KB
 View all 2 pages
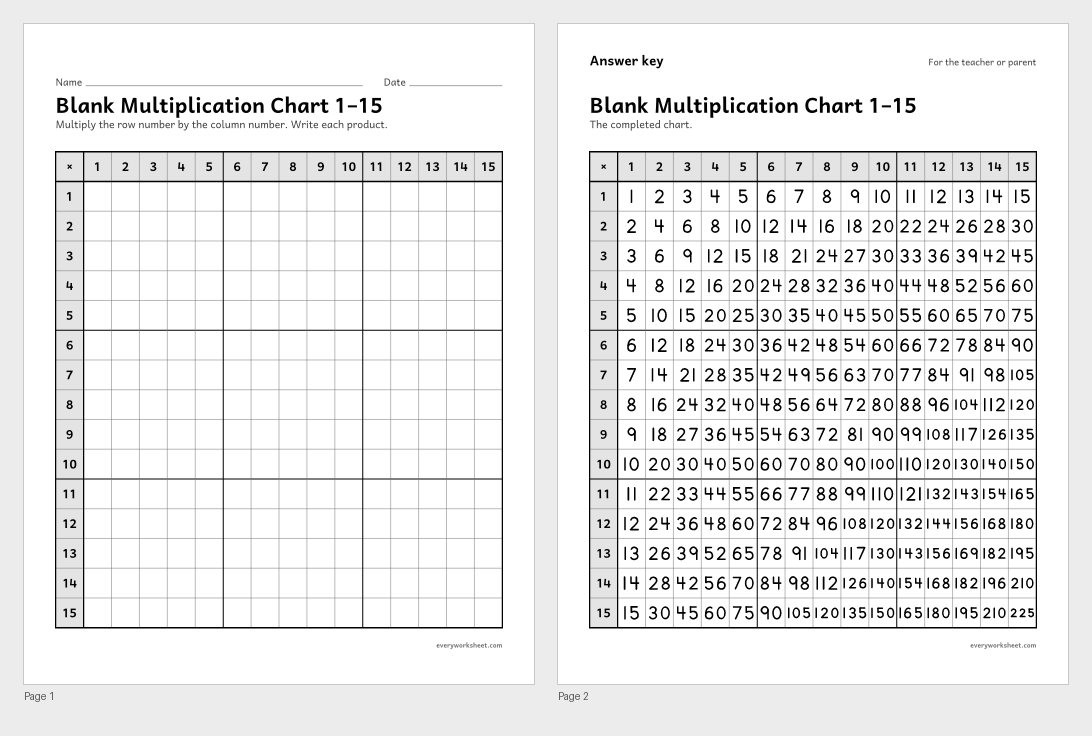
Filling in a blank 1 to 12 multiplication chart (landscape)
Answer key on page 2
2 pages34 KB
 View all 2 pages
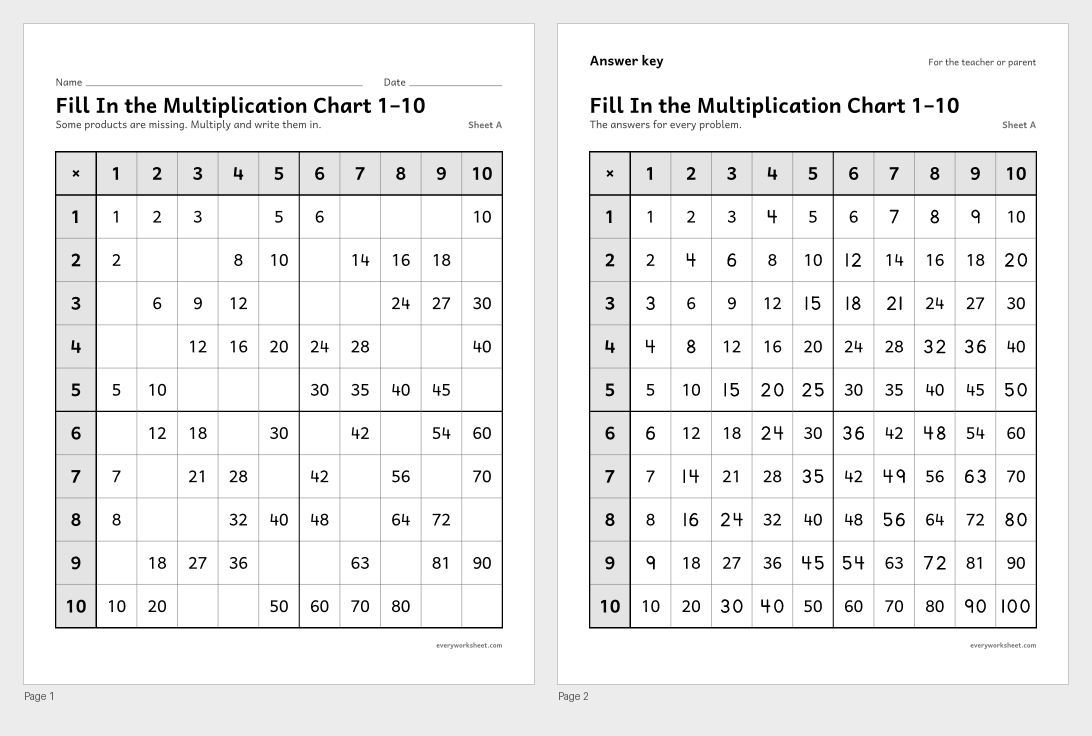
Filling in a blank 1 to 15 multiplication chart
Answer key on page 2
2 pages50 KB
 View all 2 pages
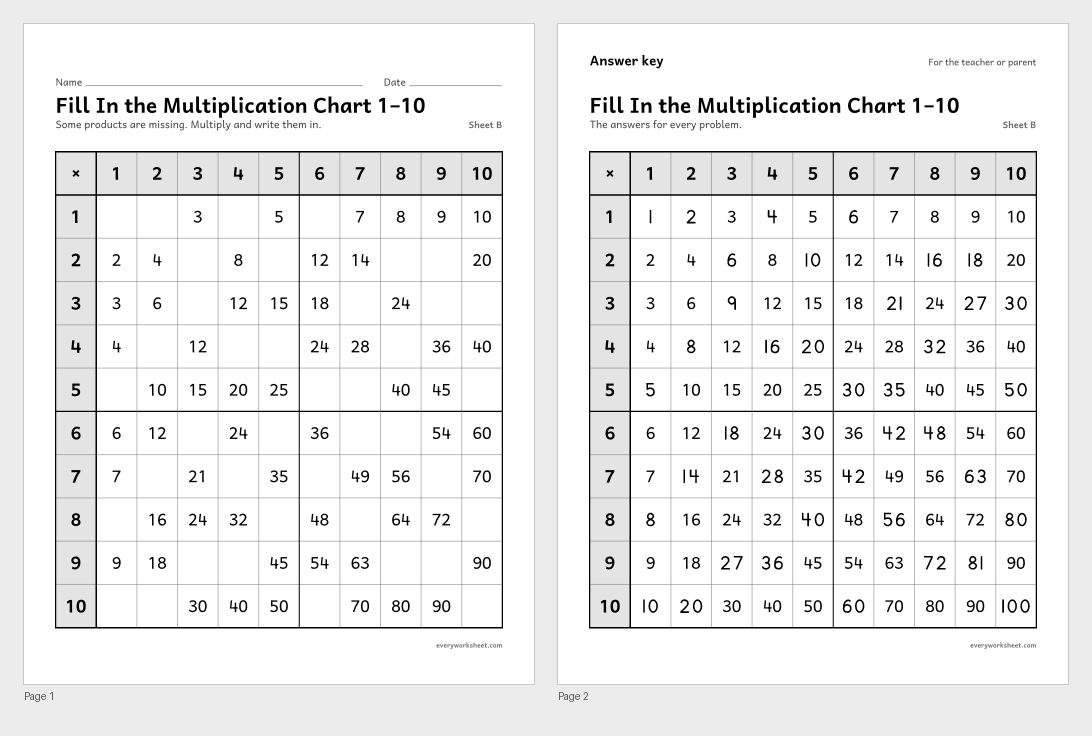
Completing a 1 to 10 multiplication chart
Answer key on page 2
2 pages36 KB
 View all 2 pages
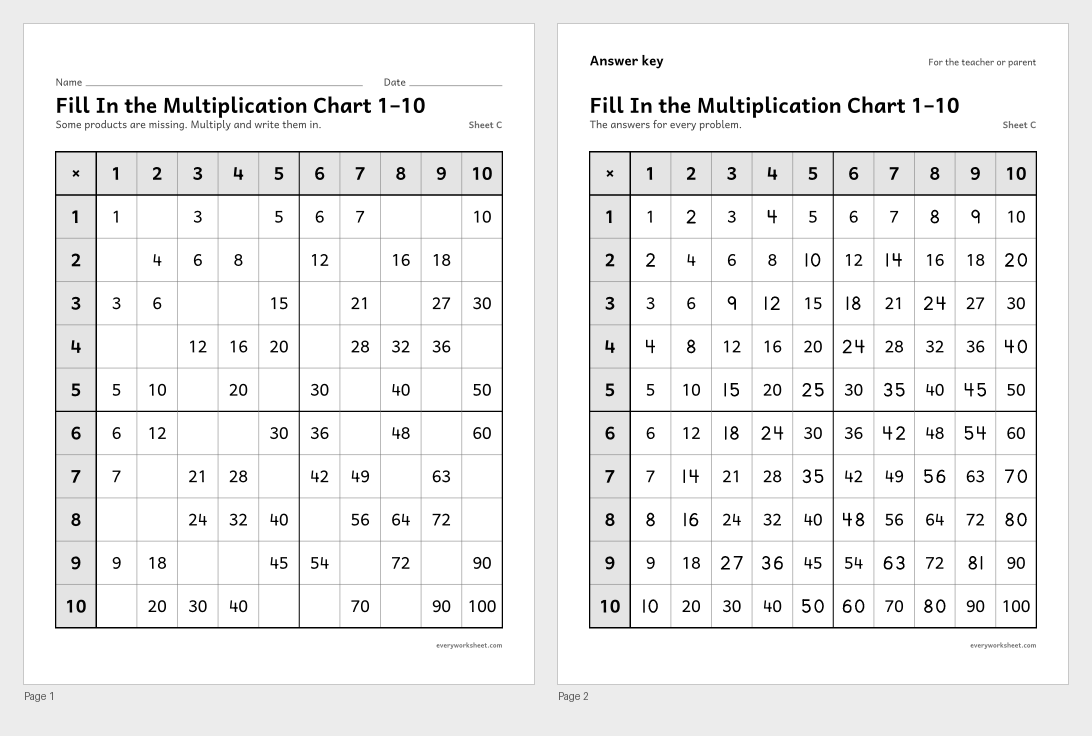
Completing a 1 to 10 multiplication chart
Answer key on page 2
2 pages36 KB
 View all 2 pages
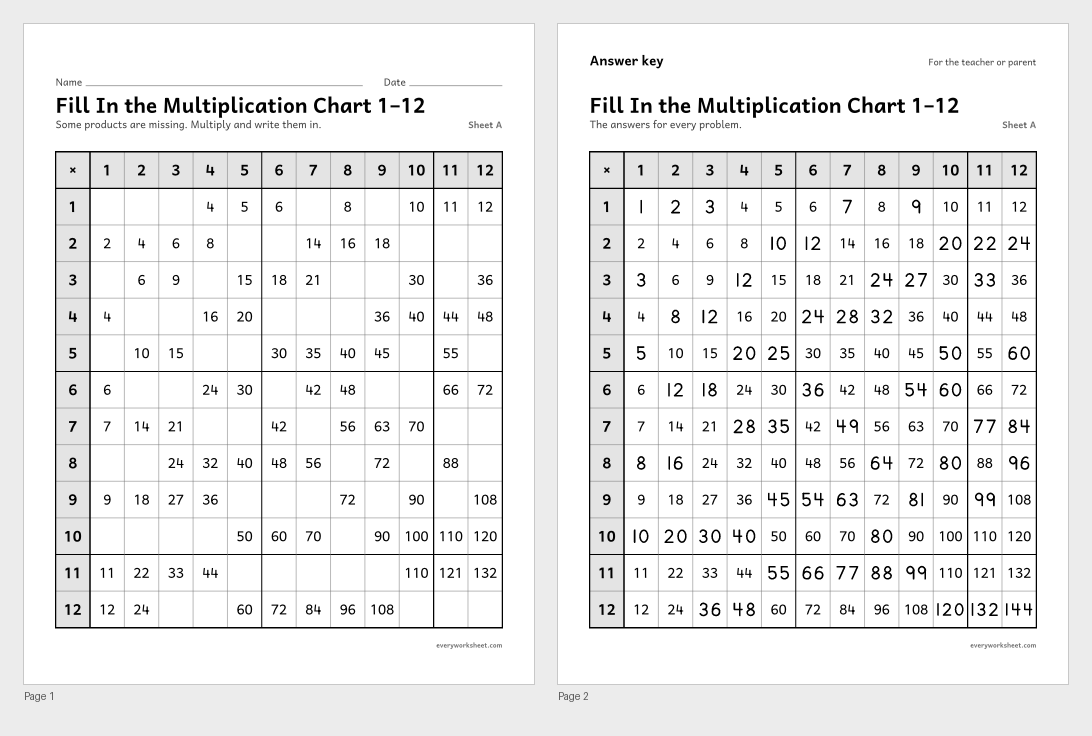
Completing a 1 to 10 multiplication chart
Answer key on page 2
2 pages36 KB
 View all 2 pages
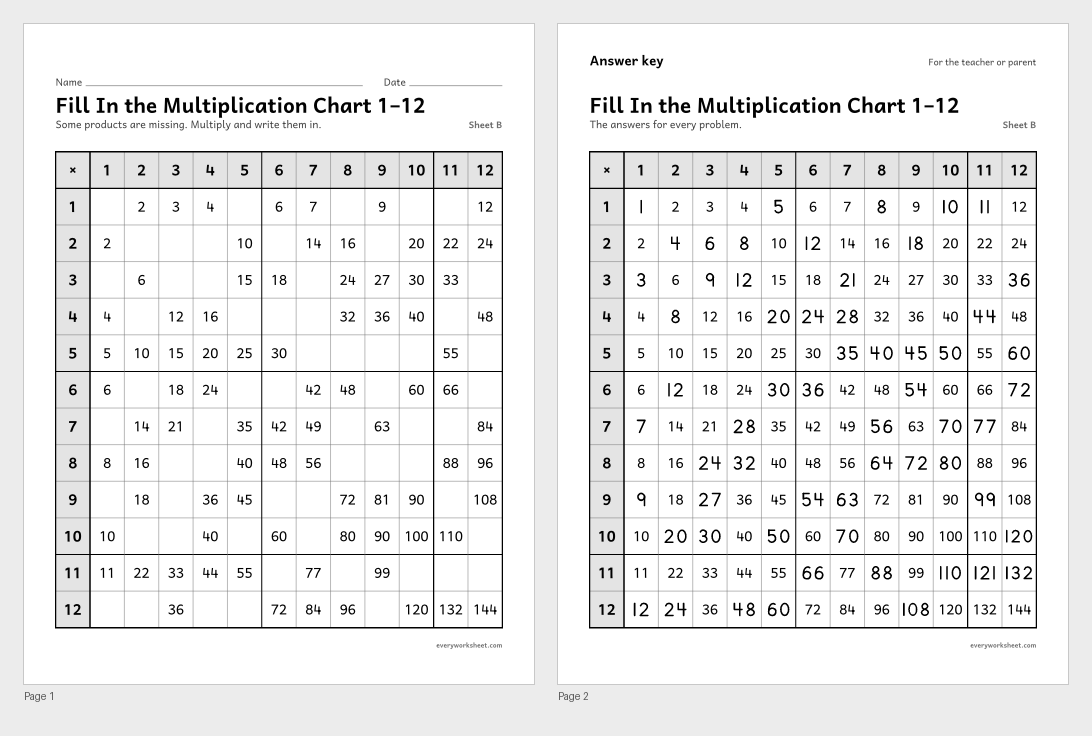
Completing a 1 to 12 multiplication chart
Answer key on page 2
2 pages38 KB
 View all 2 pages
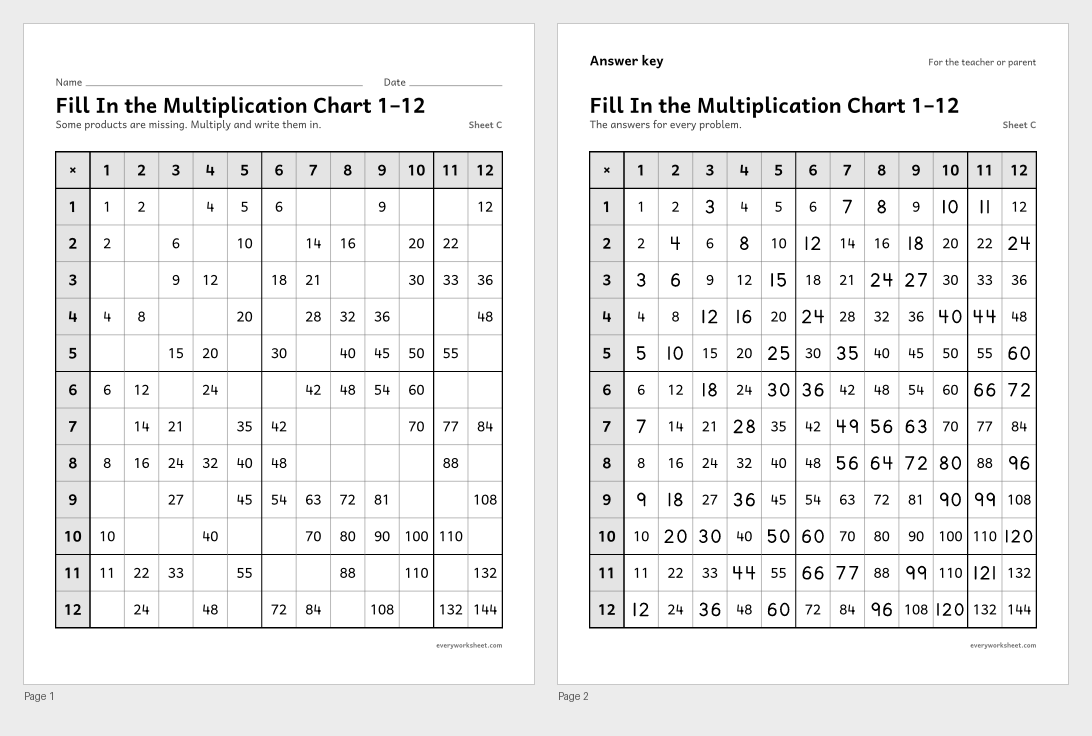
Completing a 1 to 12 multiplication chart
Answer key on page 2
2 pages39 KB
 View all 2 pages
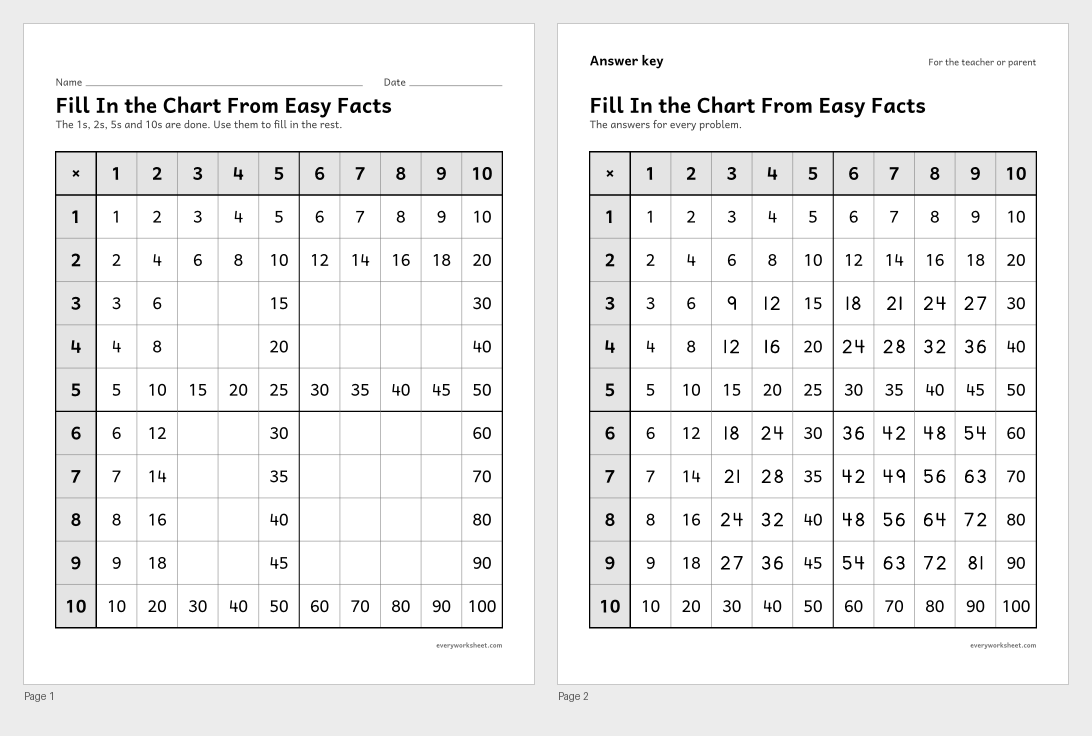
Completing a 1 to 12 multiplication chart
Answer key on page 2
2 pages38 KB
 View all 2 pages
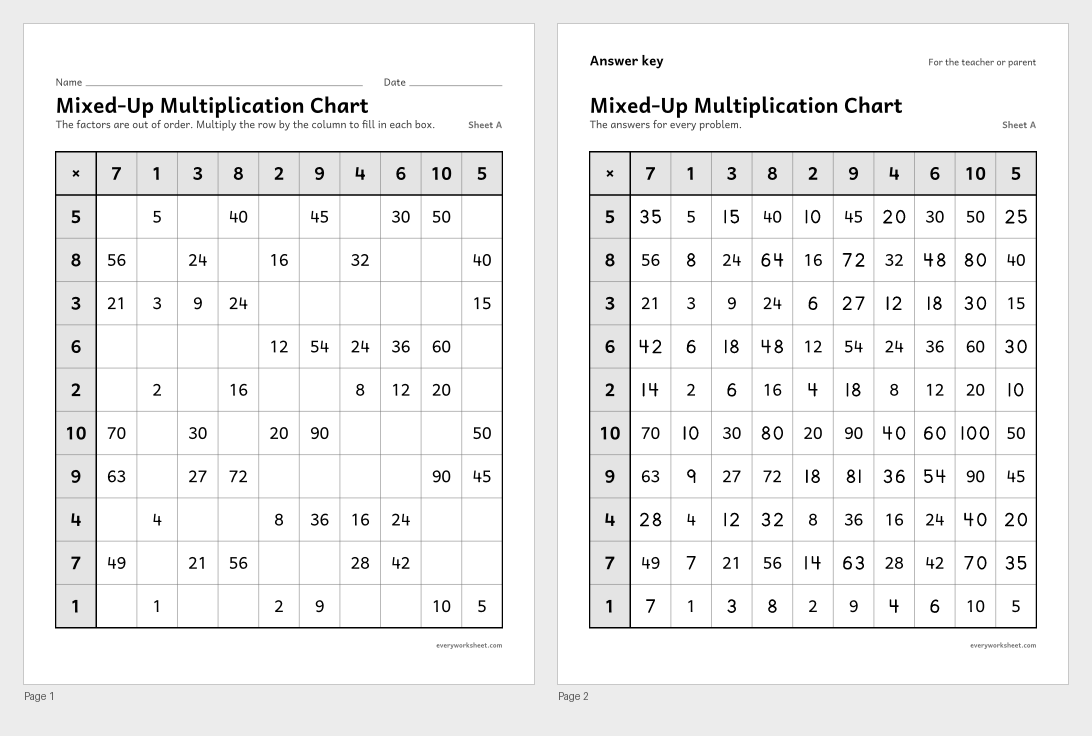
Using known facts to complete a multiplication chart
Answer key on page 2
2 pages34 KB
 View all 2 pages
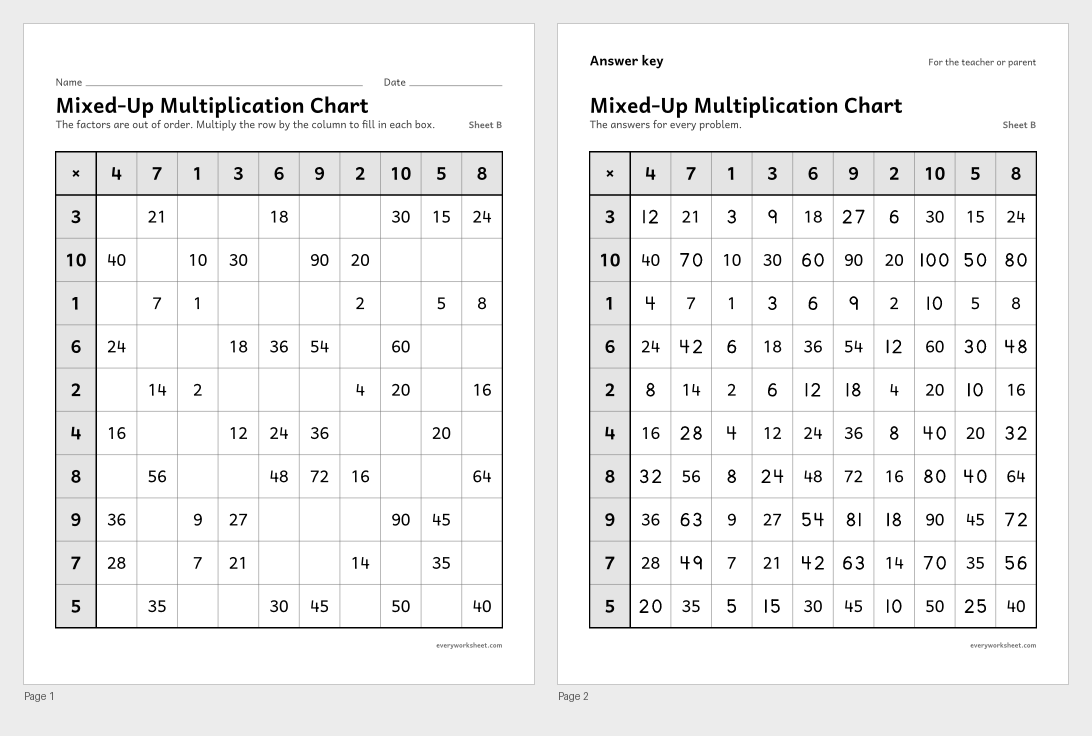
Multiplying facts within 100 in a mixed-up chart
Answer key on page 2
2 pages36 KB
 View all 2 pages
Multiplying facts within 100 in a mixed-up chart
Answer key on page 2
2 pages36 KB
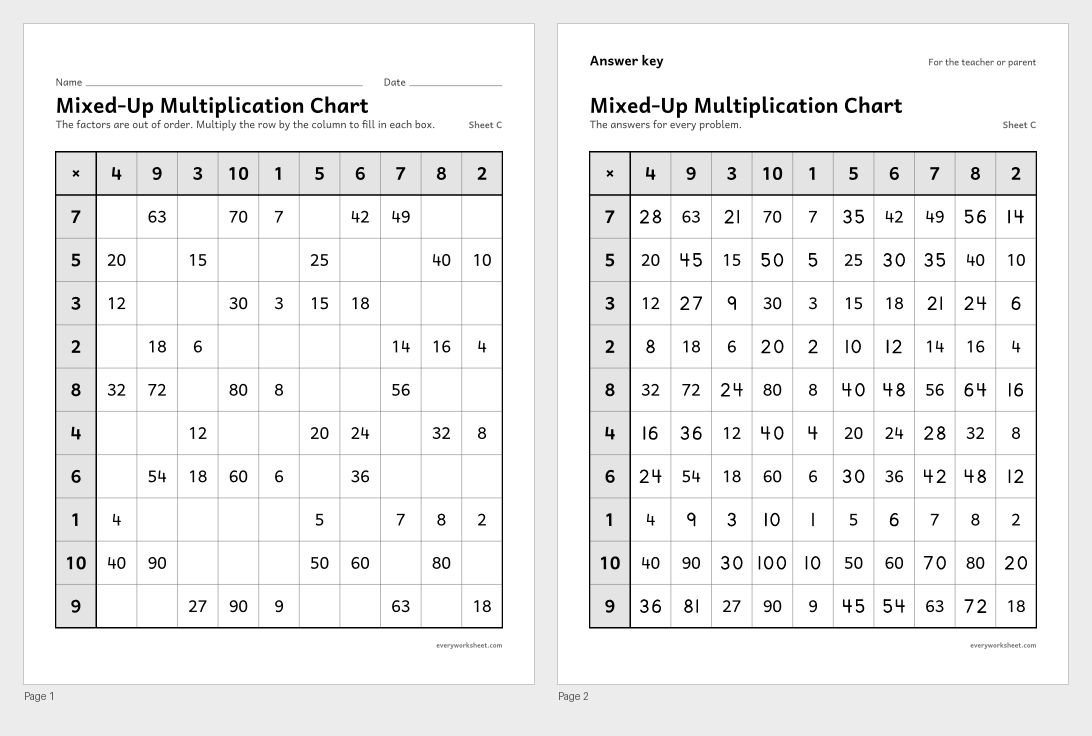 View all 2 pages
Multiplying facts within 100 in a mixed-up chart
Answer key on page 2
2 pages36 KB
 View larger
 View larger
 View larger
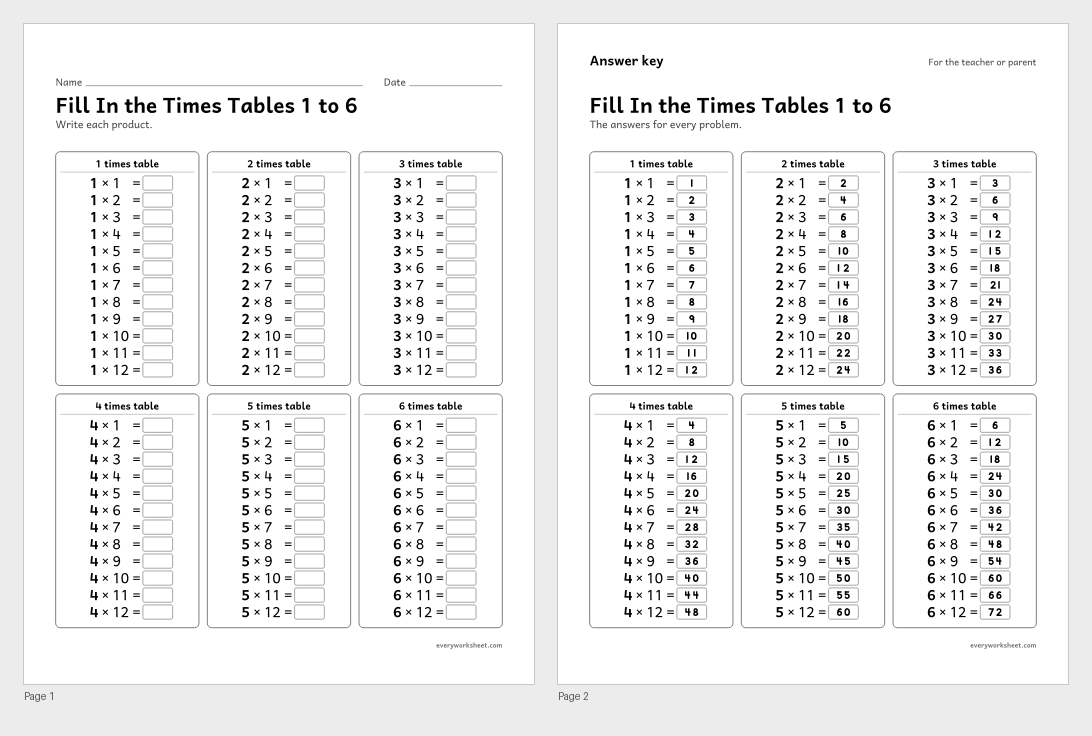 View all 2 pages
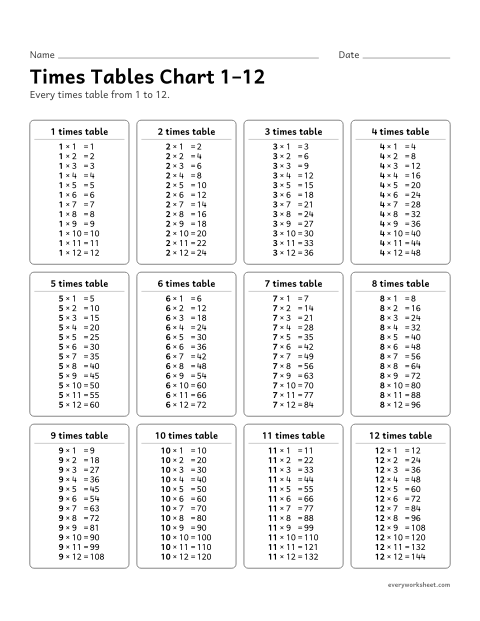
Writing the times tables 1 to 6
Answer key on page 2
2 pages195 KB
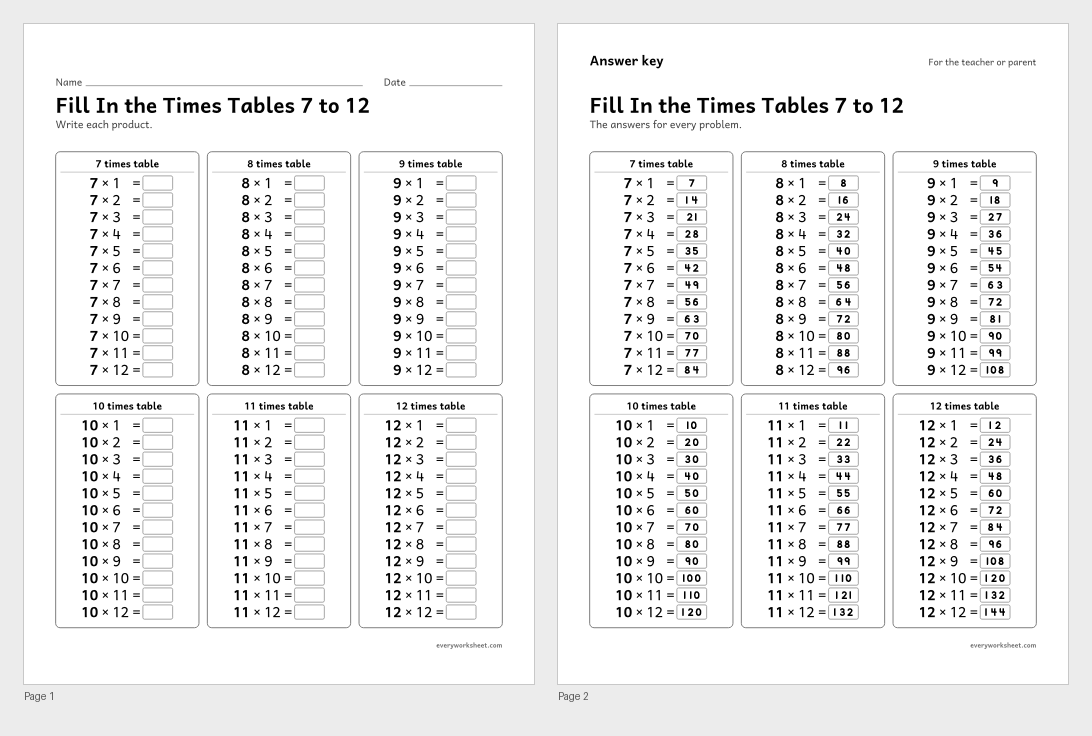 View all 2 pages
Writing the times tables 7 to 12
Answer key on page 2
2 pages195 KB
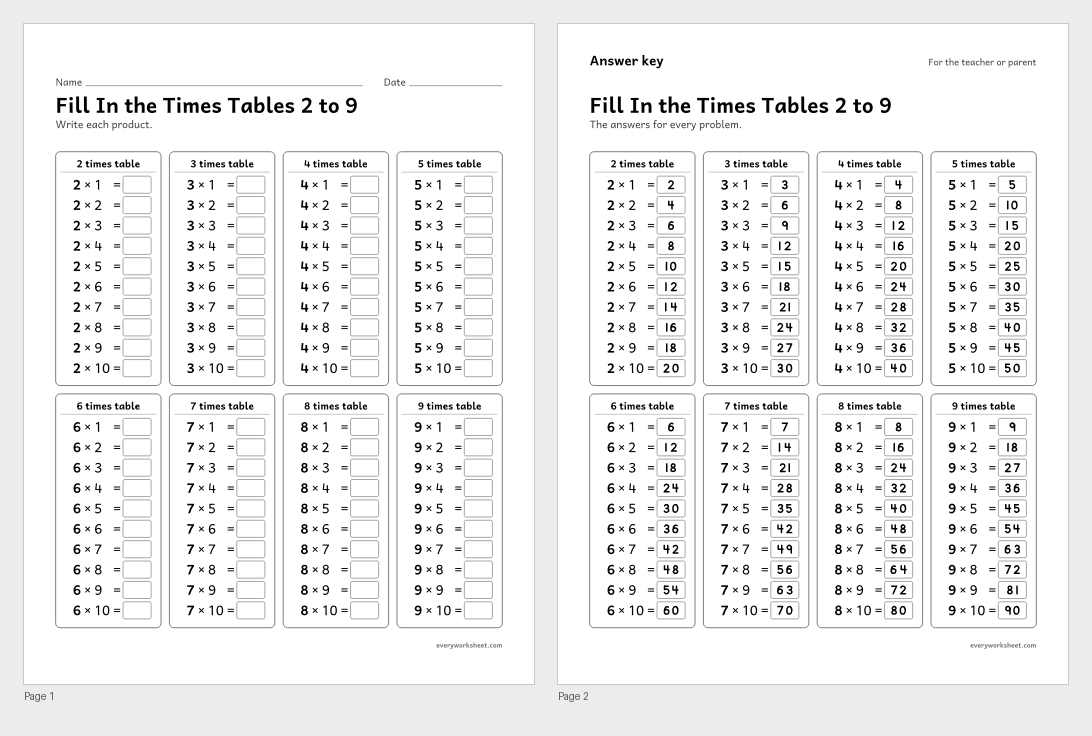 View all 2 pages
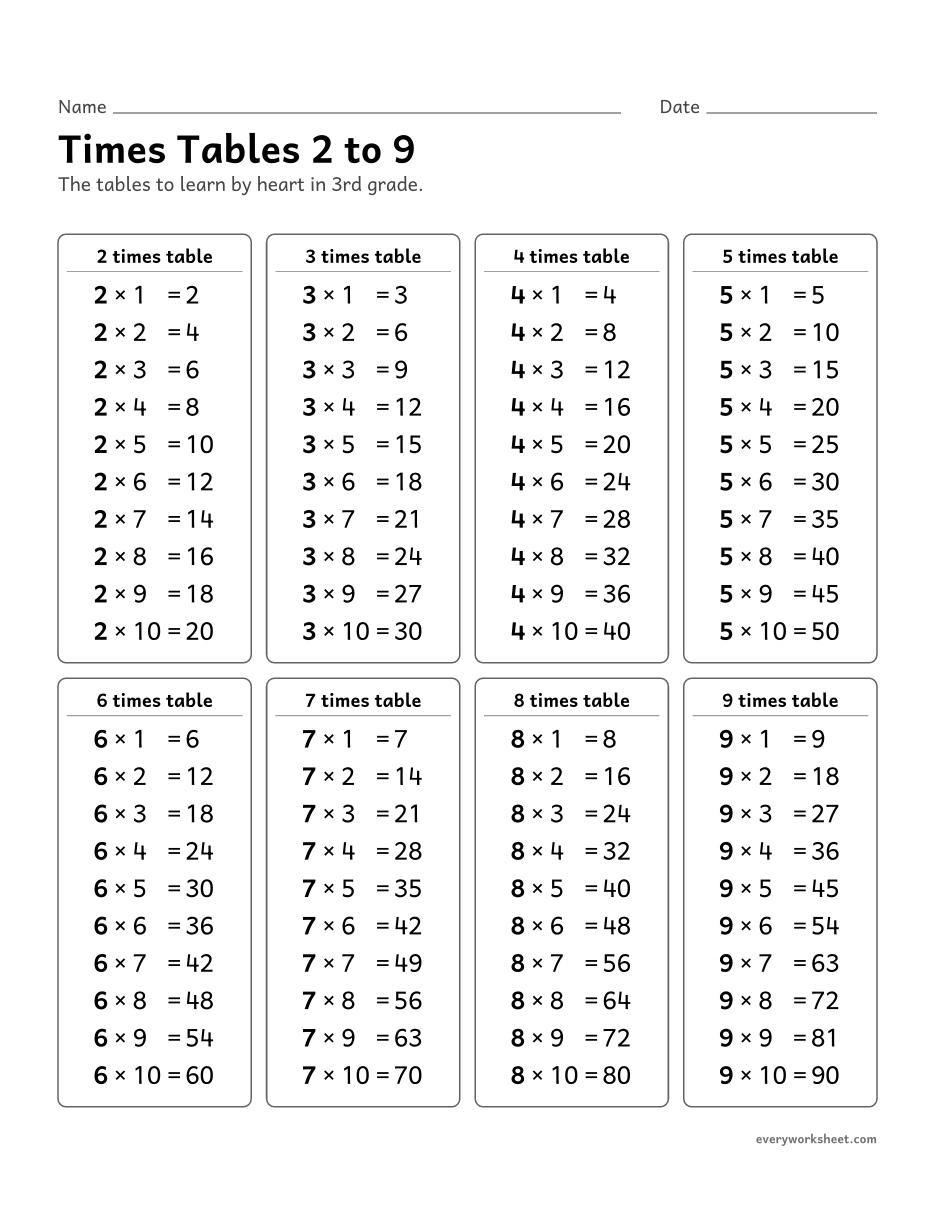
Writing the times tables 2 to 9
Answer key on page 2
2 pages215 KB
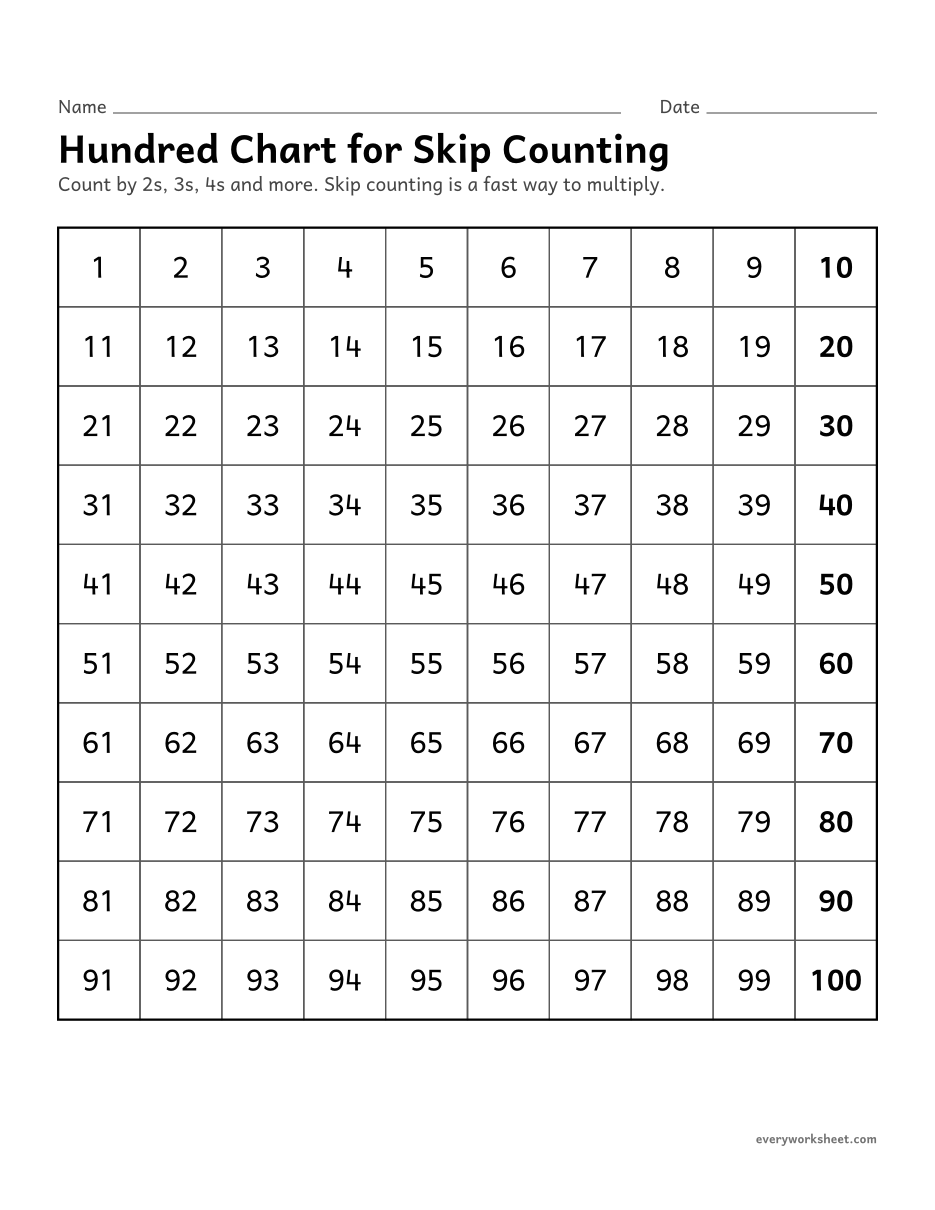 View larger
 View all 2 pages
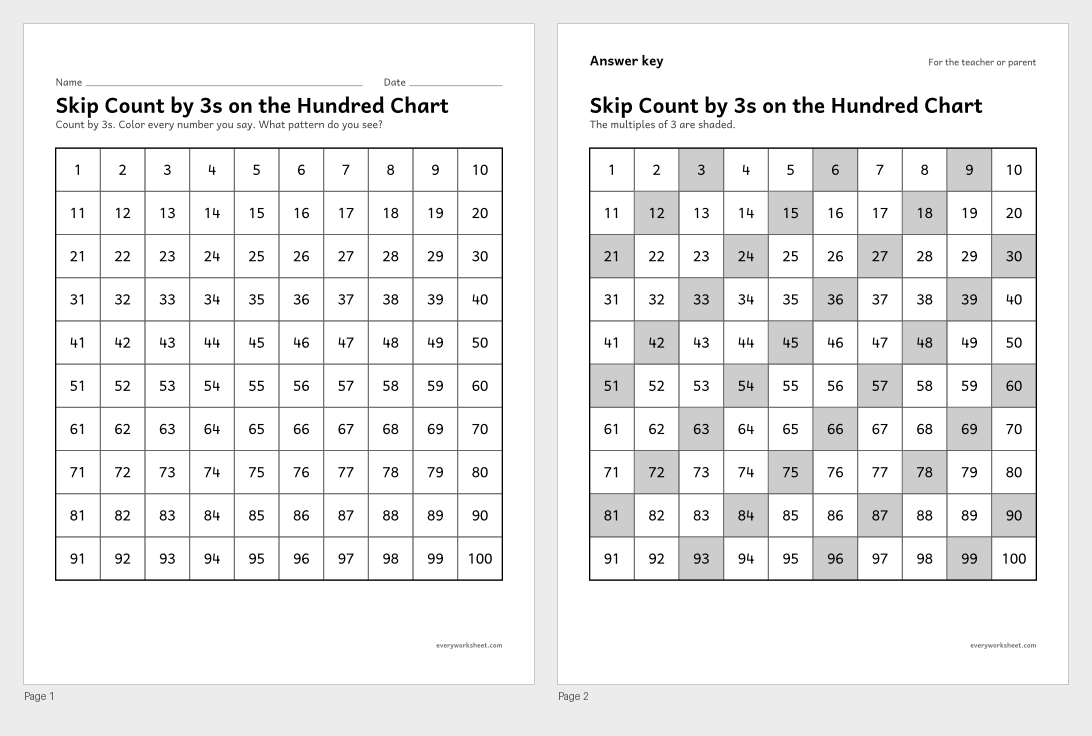
Skip counting by 3s to find multiples of 3
Answer key on page 2
2 pages32 KB
 View all 2 pages
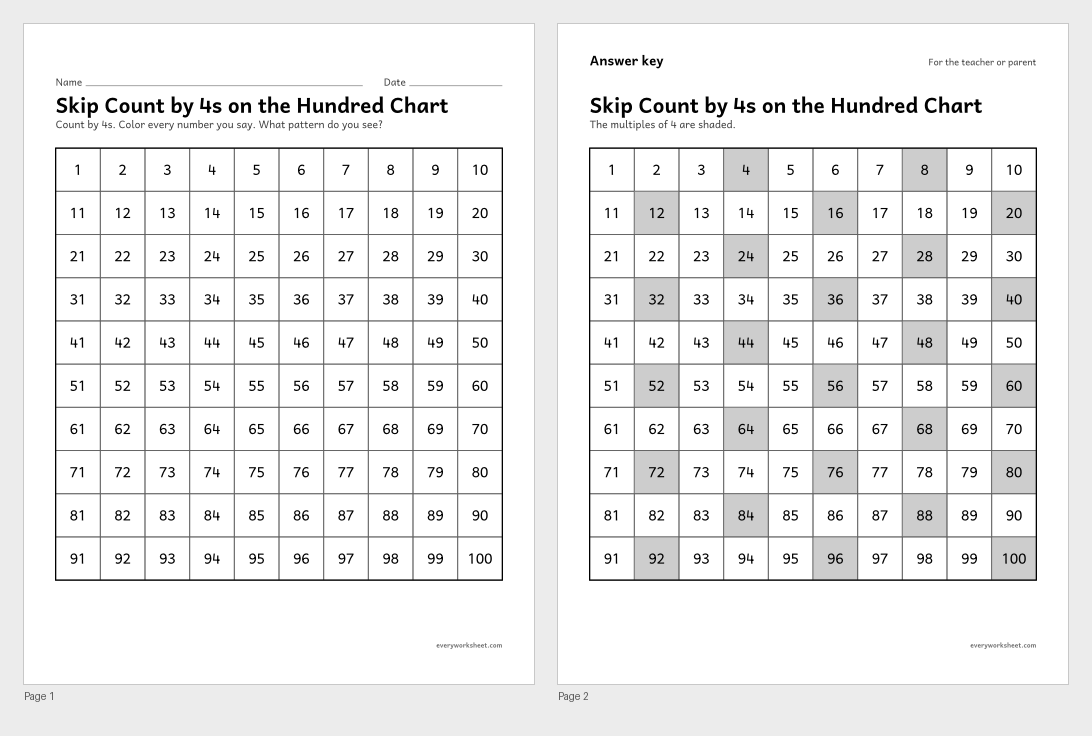
Skip counting by 4s to find multiples of 4
Answer key on page 2
2 pages32 KB
 View all 2 pages
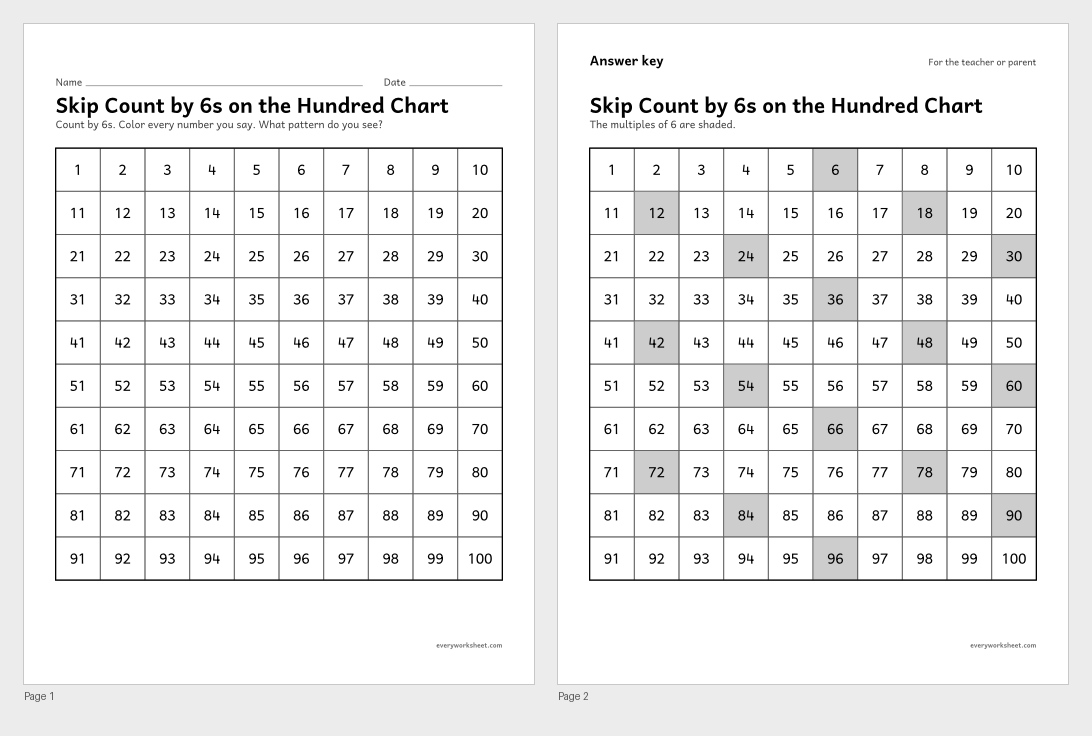
Skip counting by 6s to find multiples of 6
Answer key on page 2
2 pages32 KB
 View all 2 pages
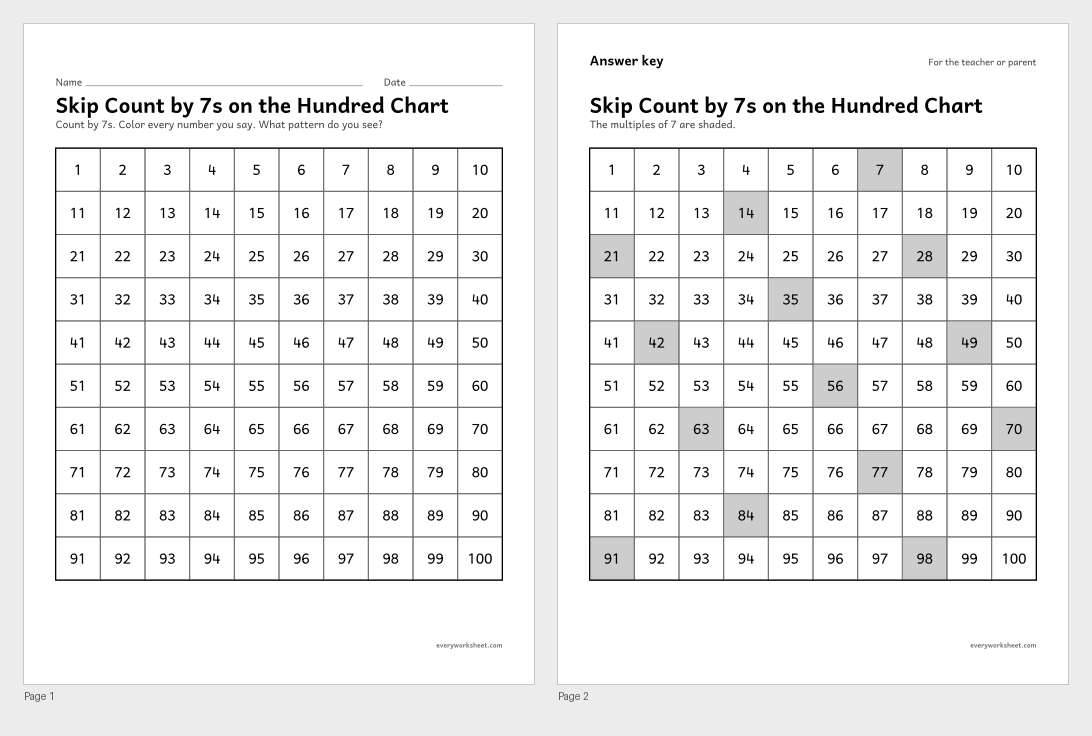
Skip counting by 7s to find multiples of 7
Answer key on page 2
2 pages32 KB
 View all 2 pages
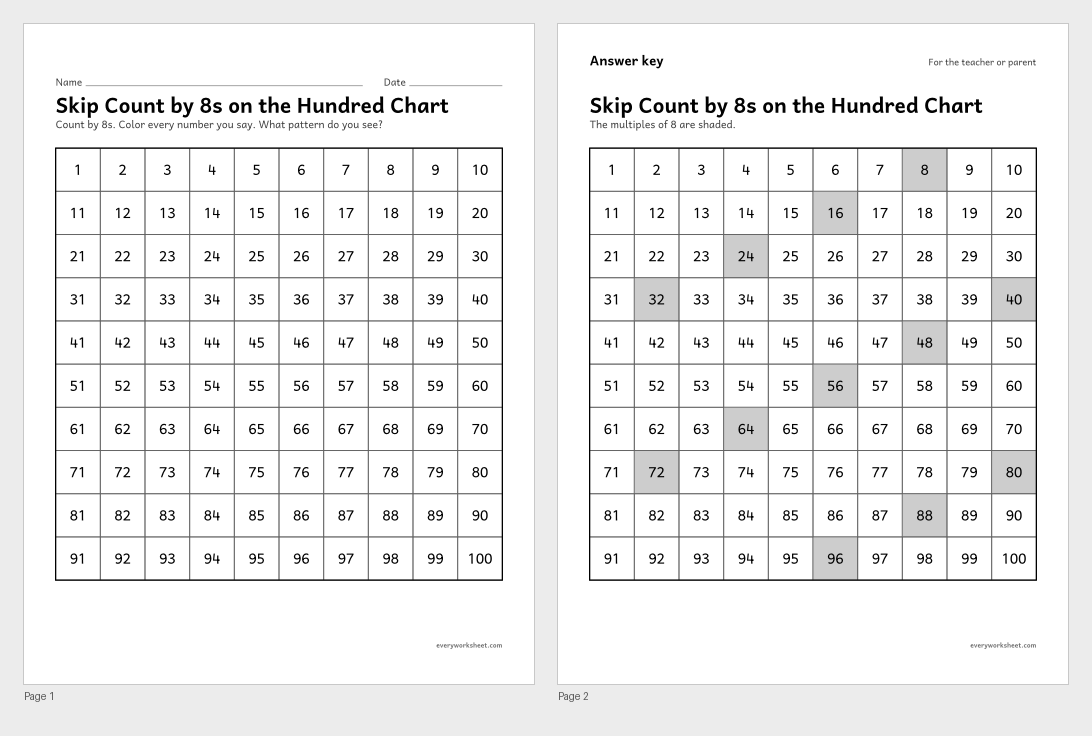
Skip counting by 8s to find multiples of 8
Answer key on page 2
2 pages32 KB
 View all 2 pages
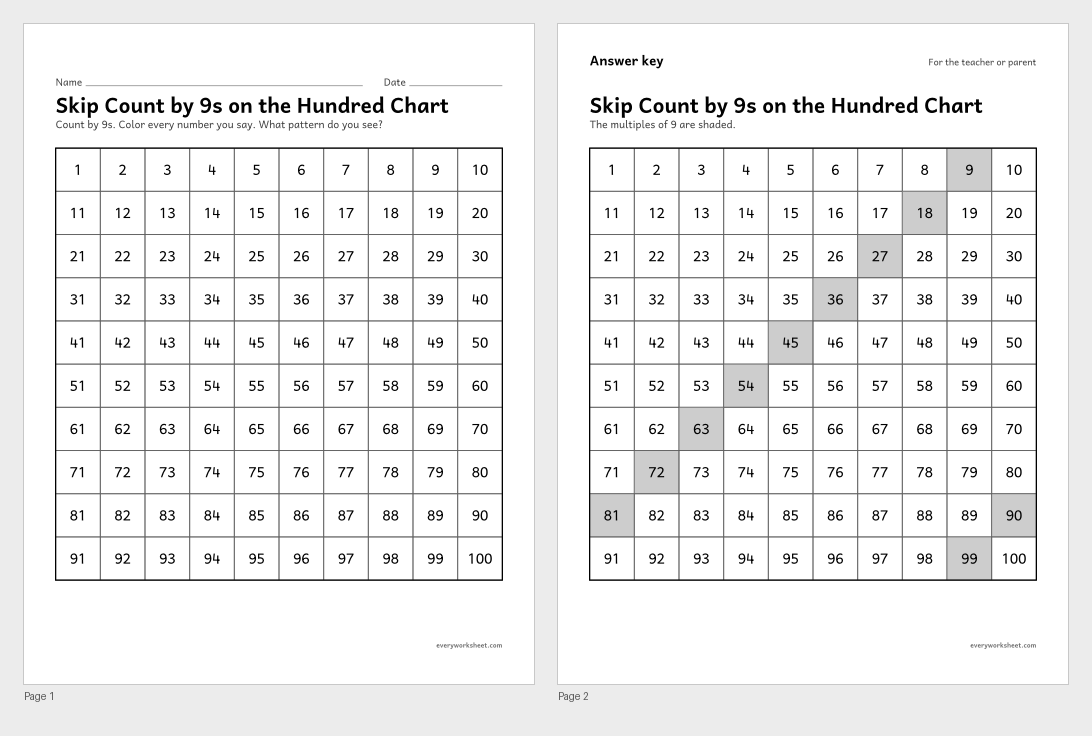
Skip counting by 9s to find multiples of 9
Answer key on page 2
2 pages32 KB
 View all 2 pages
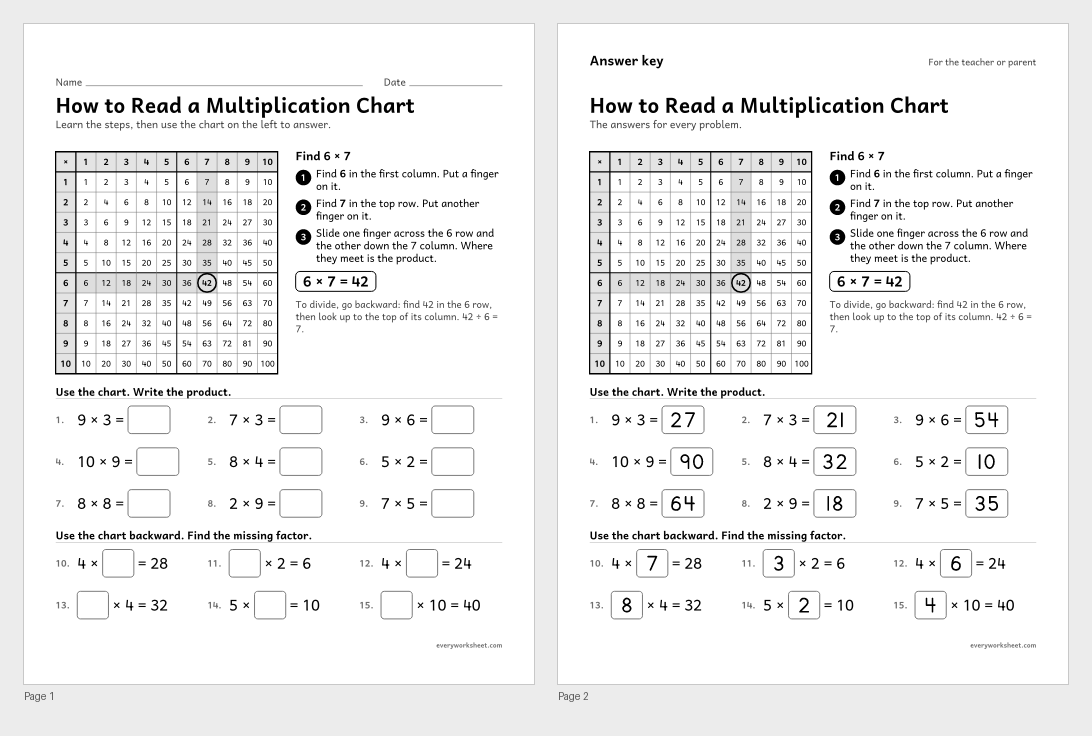
Reading a multiplication chart to multiply and divide
Answer key on page 2
2 pages94 KB
 View all 2 pages
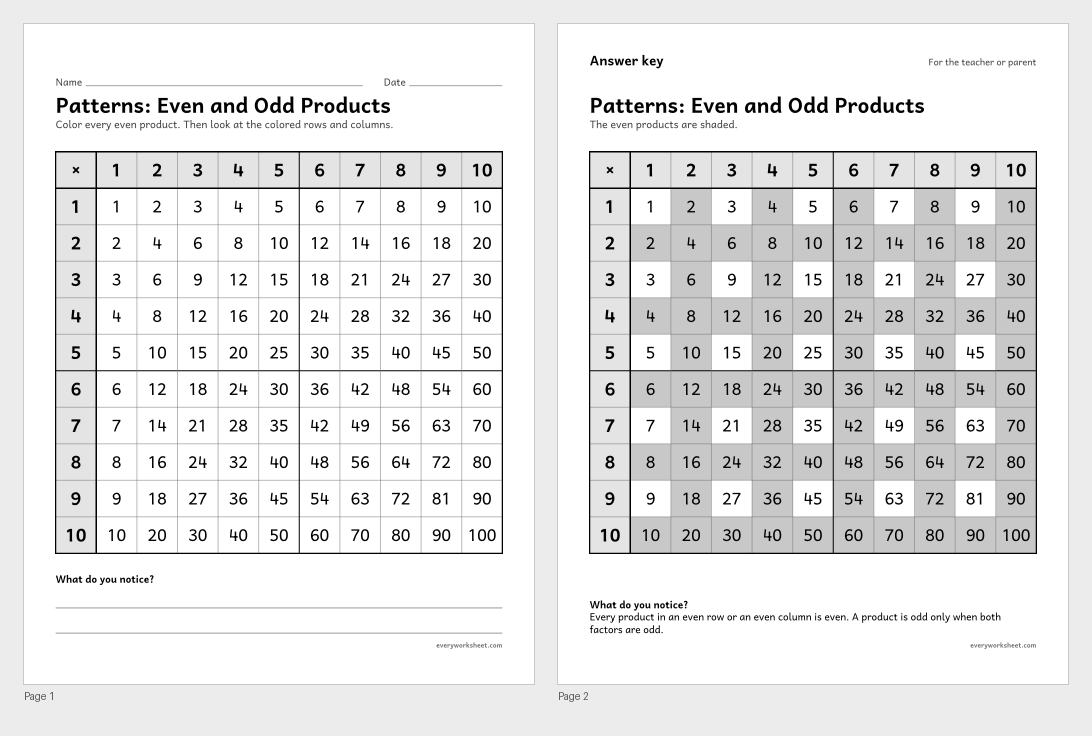
Even and odd patterns in the multiplication table
Answer key on page 2
2 pages35 KB
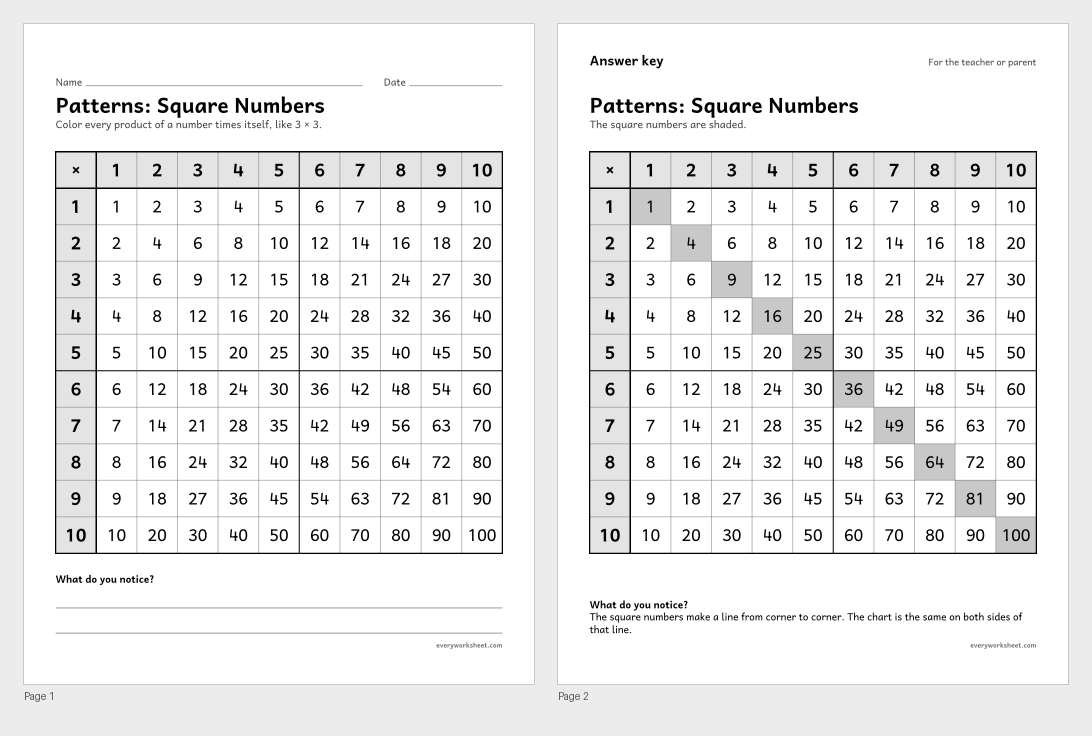 View all 2 pages
Square numbers on the multiplication chart
Answer key on page 2
2 pages35 KB
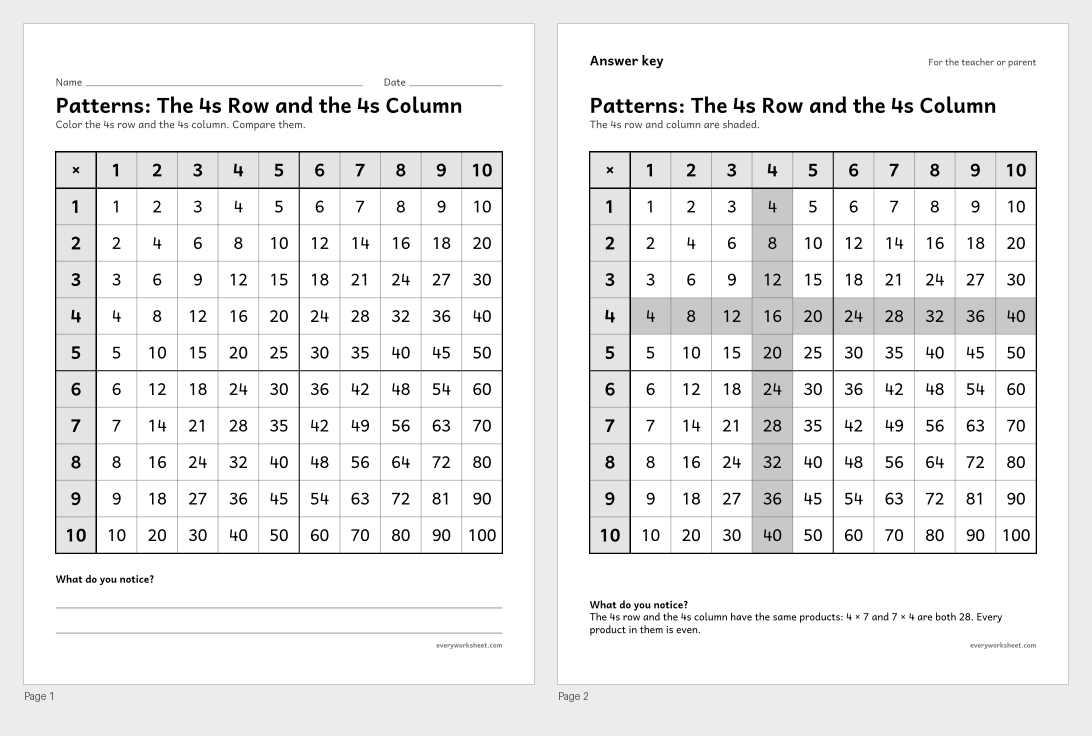 View all 2 pages
Seeing the commutative property in the multiplication chart
Answer key on page 2
2 pages35 KB
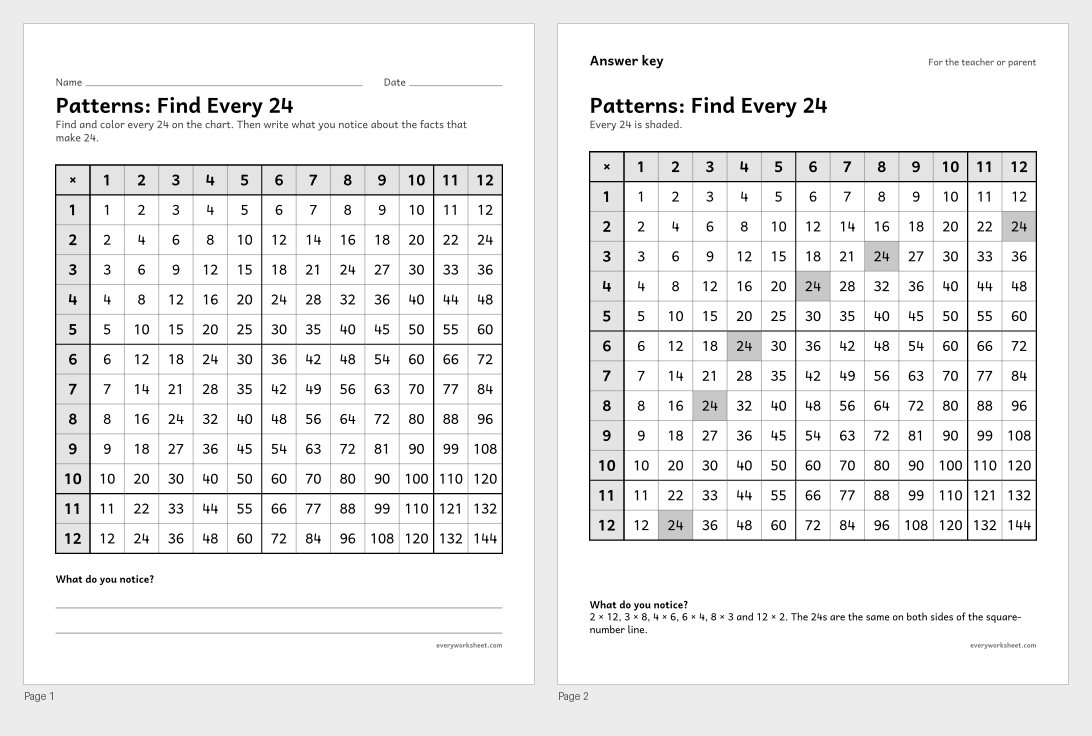 View all 2 pages
Finding all the factor pairs of a product on the chart
Answer key on page 2
2 pages38 KB
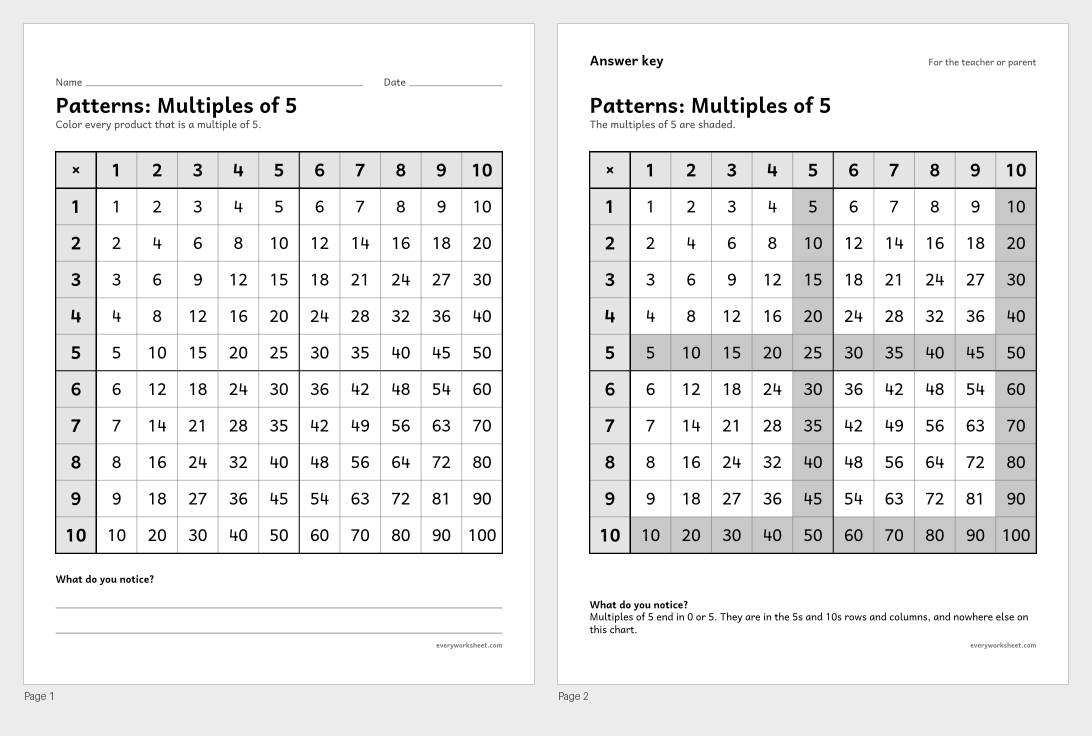 View all 2 pages
Multiples of 5 on the multiplication chart
Answer key on page 2
2 pages35 KB
 View all 2 pages
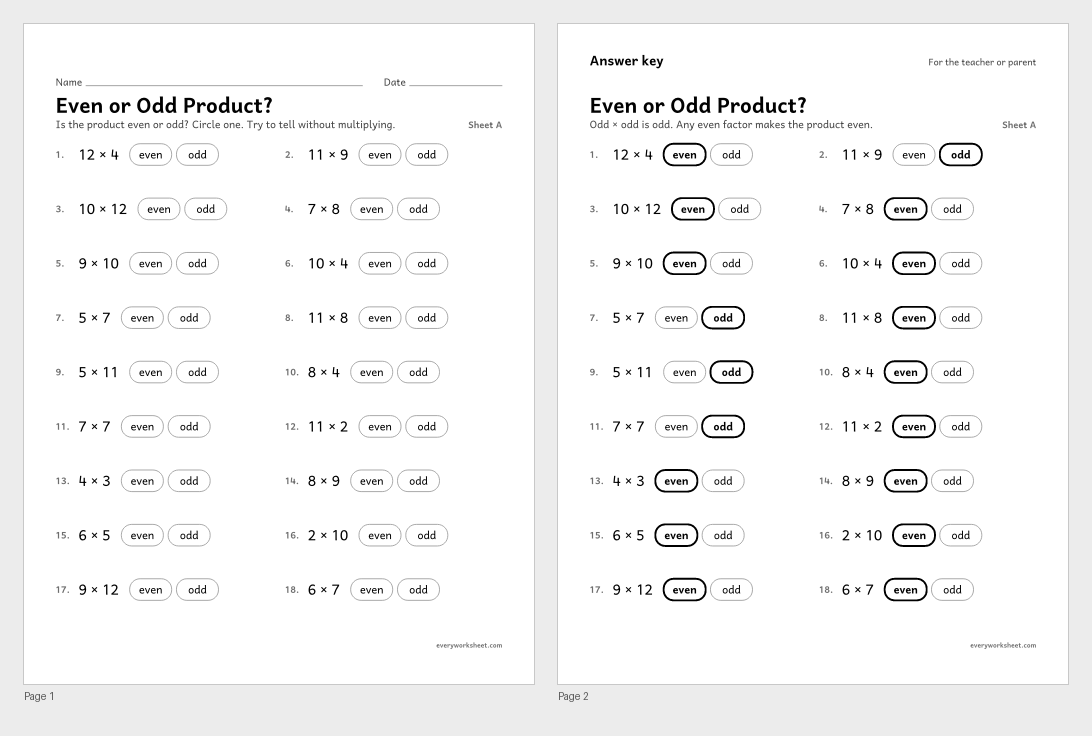
Predicting whether a product is even or odd
Answer key on page 2
2 pages92 KB
 View all 2 pages
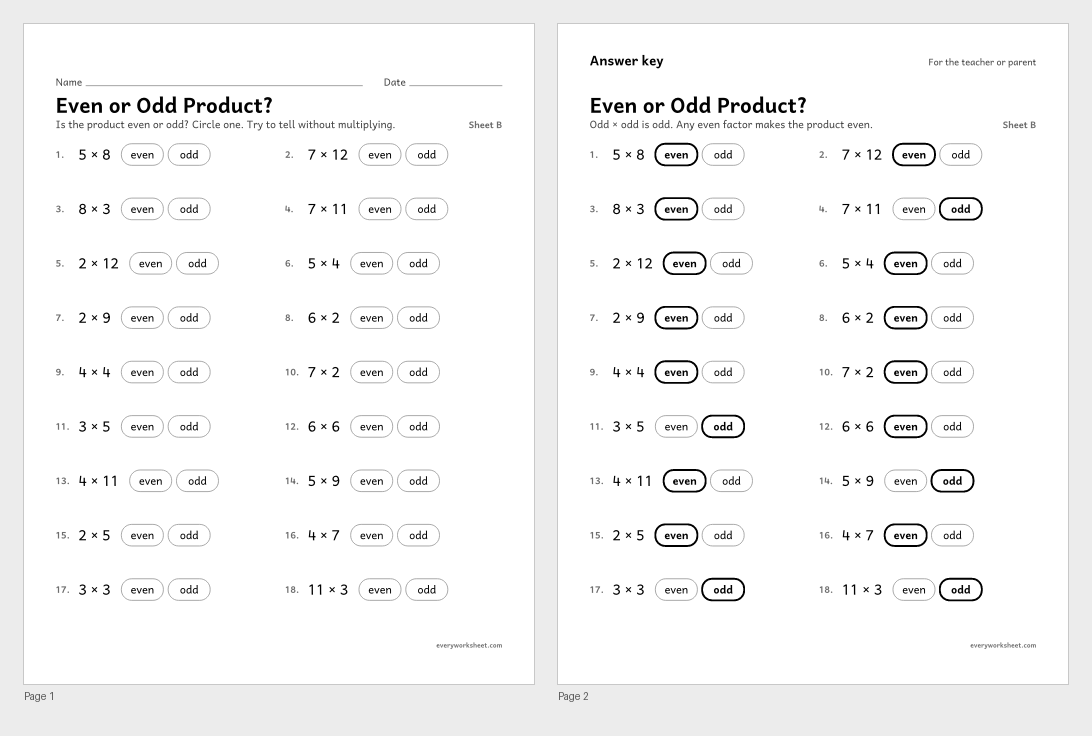
Predicting whether a product is even or odd
Answer key on page 2
2 pages92 KB
 View all 2 pages
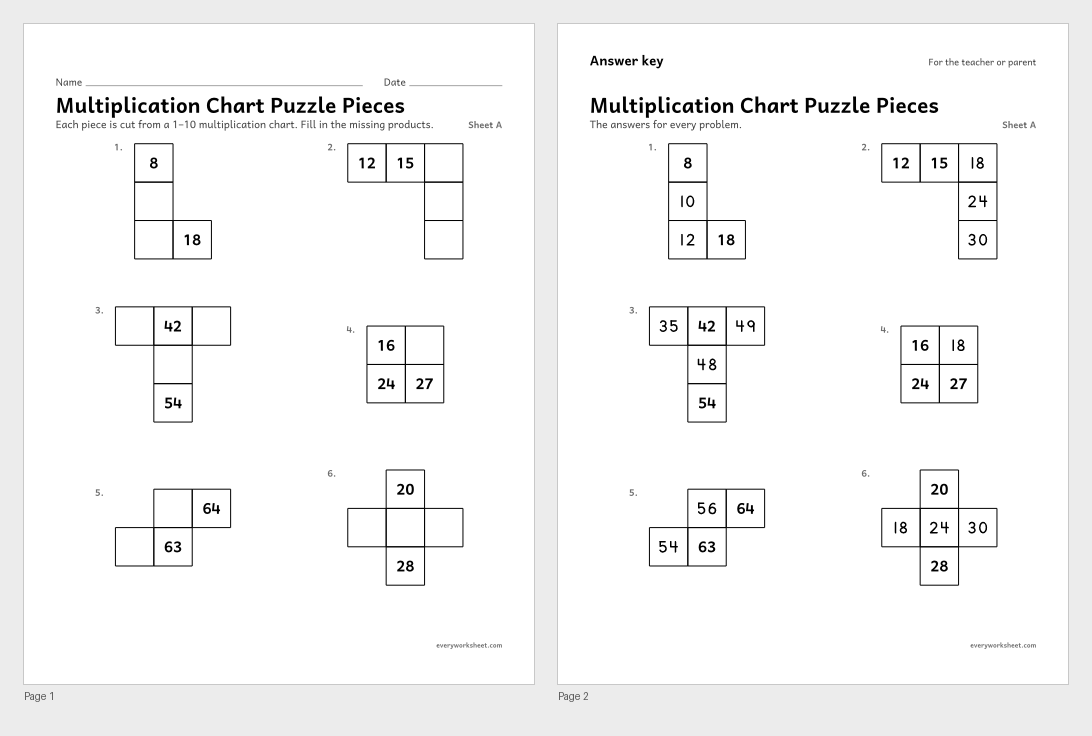
Using patterns in the multiplication chart
Answer key on page 2
2 pages38 KB
 View all 2 pages
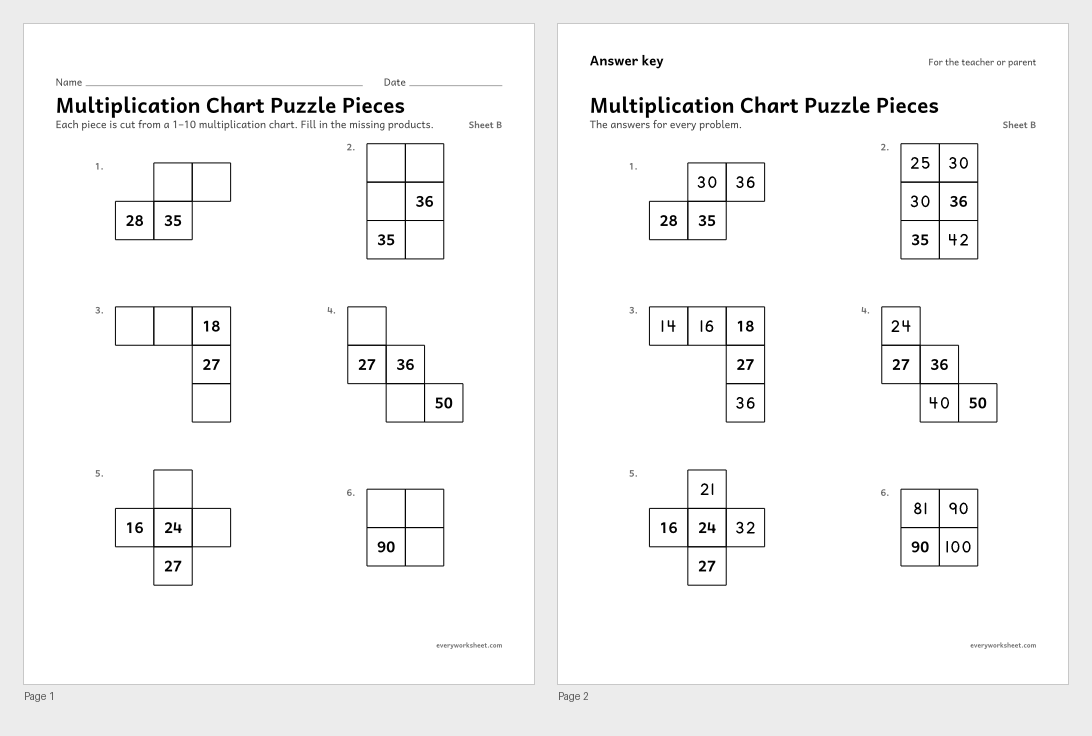
Using patterns in the multiplication chart
Answer key on page 2
2 pages39 KB
Print at 100% (actual size) for the cleanest tracing lines.
A multiplication chart is a grid of products. The numbers down the left side and across the top are the factors, and the box where a row and a column meet holds their product: go across the 6 row and down the 7 column and you land on 42, because 6 × 7 = 42. Every fact from 1 × 1 to 12 × 12 sits on one page.
These charts are made for printing: black and white, heavy outer lines, shaded factor rows, and a slightly heavier line after every 5 and 10 so a child's eye never slips into the wrong row. Choose 1–10 for the facts children must know by heart in 3rd grade, 1–12 for the full times tables, 0–12 to show the zero facts, and 1–15 or 1–20 for older students. The 1–10 and 1–12 charts also come in landscape for the wall.
Children learn more from filling in a chart than from reading one. The blank charts, the partly filled charts and the mixed-up charts (rows and columns out of order) all have answer keys on page 2. The pattern pages ask children to color the even products, the square numbers or one row and its matching column, and to say what they notice.
CCSS.MATH.CONTENT.3.OA.C.7Fluently multiply and divide within 100, using strategies such as the relationship between multiplication and division (e.g., knowing that 8 × 5 = 40, one knows 40 ÷ 5 = 8) or properties of operations. By the end of Grade 3, know from memory all products of two one-digit numbers.CCSS.MATH.CONTENT.3.OA.D.9Identify arithmetic patterns (including patterns in the addition table or multiplication table), and explain them using properties of operations. For example, observe that 4 times a number is always even, and explain why 4 times a number can be decomposed into two equal addends.CCSS.MATH.CONTENT.3.OA.B.5Apply properties of operations as strategies to multiply and divide. Examples: If 6 × 4 = 24 is known, then 4 × 6 = 24 is also known. (Commutative property of multiplication.) 3 × 5 × 2 can be found by 3 × 5 = 15, then 15 × 2 = 30, or by 5 × 2 = 10, then 3 × 10 = 30. (Associative property of multiplication.) Knowing that 8 × 5 = 40 and 8 × 2 = 16, one can find 8 × 7 as 8 × (5 + 2) = (8 × 5) + (8 × 2) = 40 + 16 = 56. (Distributive property.)CCSS.MATH.CONTENT.3.OA.B.6Understand division as an unknown-factor problem. For example, find 32 ÷ 8 by finding the number that makes 32 when multiplied by 8.Find the first number in the left column and the second number in the top row. Slide across the row and down the column. The number in the box where they meet is the product. For 4 × 9, go across the 4 row to the 9 column: 36.
The 1–10 chart covers every fact children must know from memory by the end of 3rd grade. The 1–12 chart adds the 11s and 12s that many classes also learn. The 1–15 and 1–20 charts are for older students and for finding bigger products quickly.
Yes. The blank 1–10, 1–12 and 1–15 charts and all the partly filled charts have the completed chart as an answer key on page 2 of the PDF.
The chart is the same on both sides of the square-number diagonal, because the order of the factors does not change the product. Even rows and columns hold only even products, the 5s end in 0 or 5, and the 9s go up by 1 ten and down by 1 one each time.
Yes. Every chart is black and white with light gray headers that copy well, on US Letter or A4.