 View larger
Weather and climate poster for 3rd grade
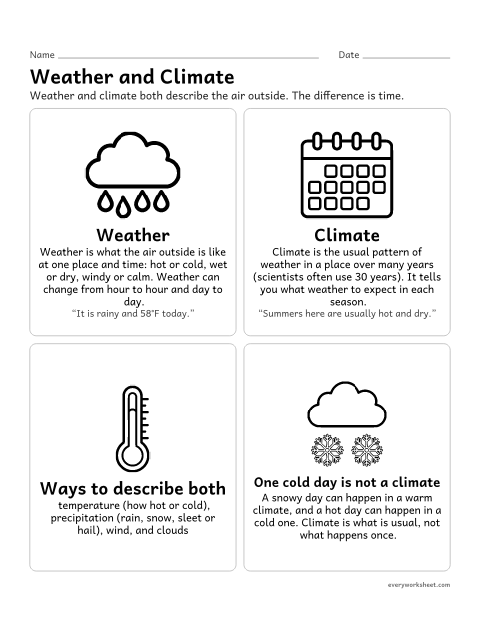
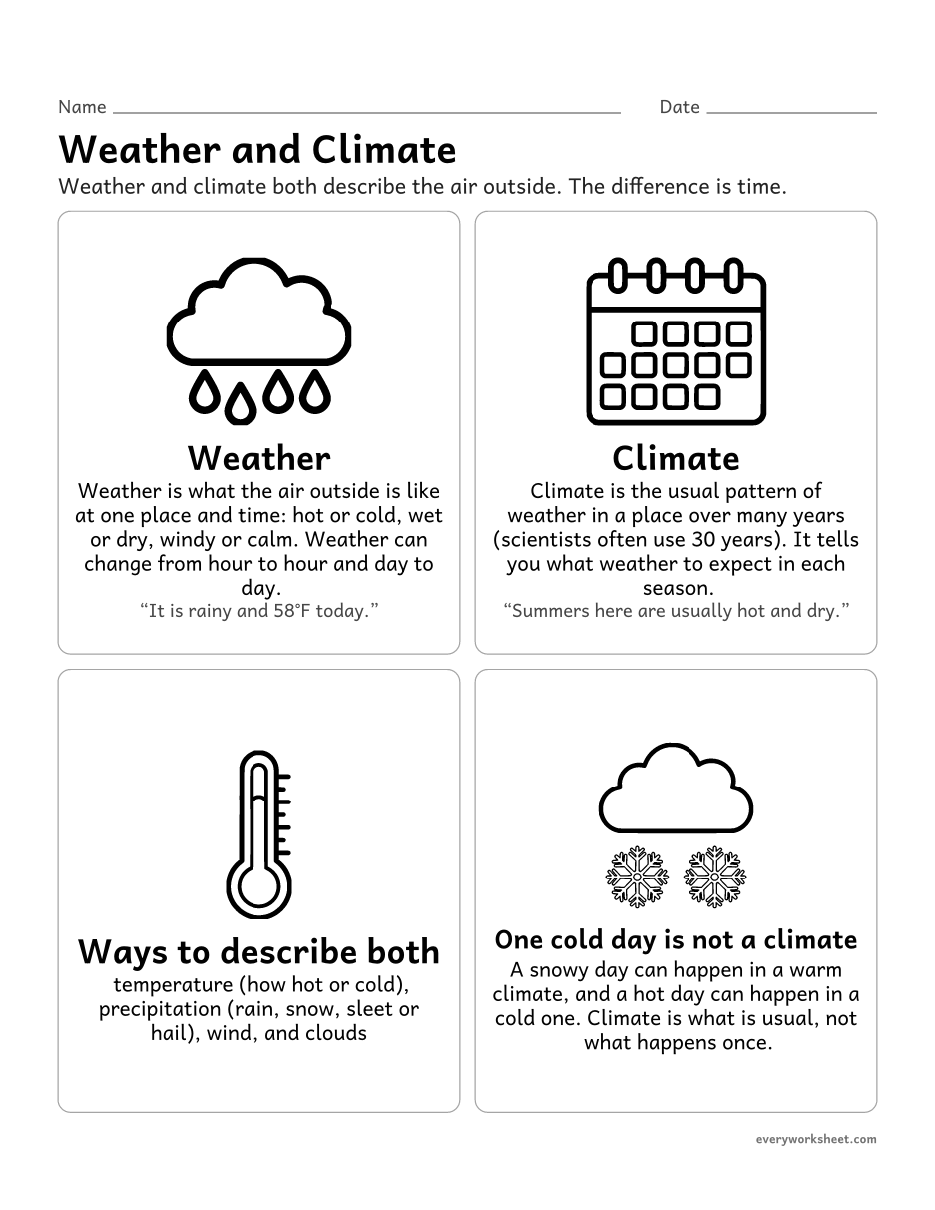
Telling weather (the conditions on one day) from climate (the usual pattern over many years)
1 page60 KB
Tell weather from climate, read weather tools and data tables, make and read bar graphs, compare climates and label Earth’s climate zones.
View largerTelling weather (the conditions on one day) from climate (the usual pattern over many years)
1 page60 KB
 View all 2 pages
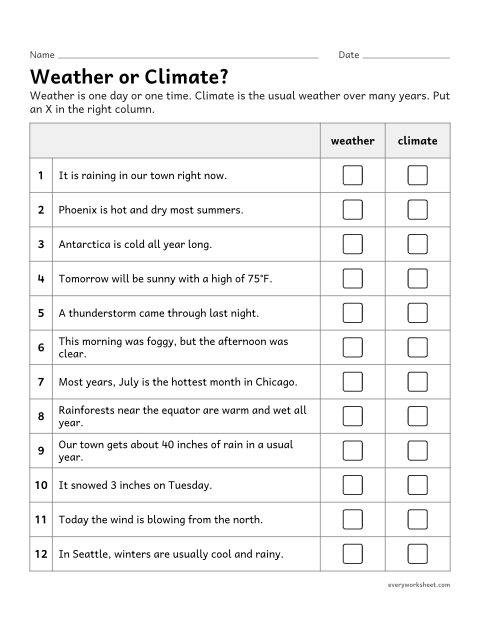
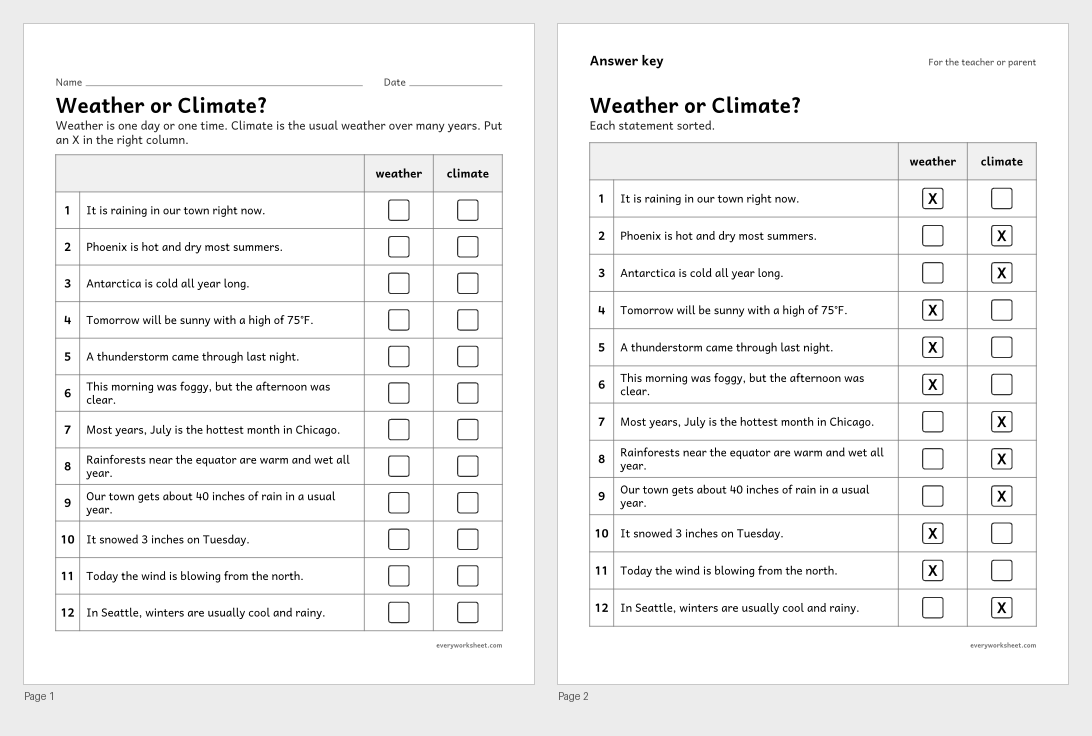
Sorting statements into weather (one time) and climate (the usual pattern over many years)
Answer key on page 2
2 pages50 KB
 View all 2 pages
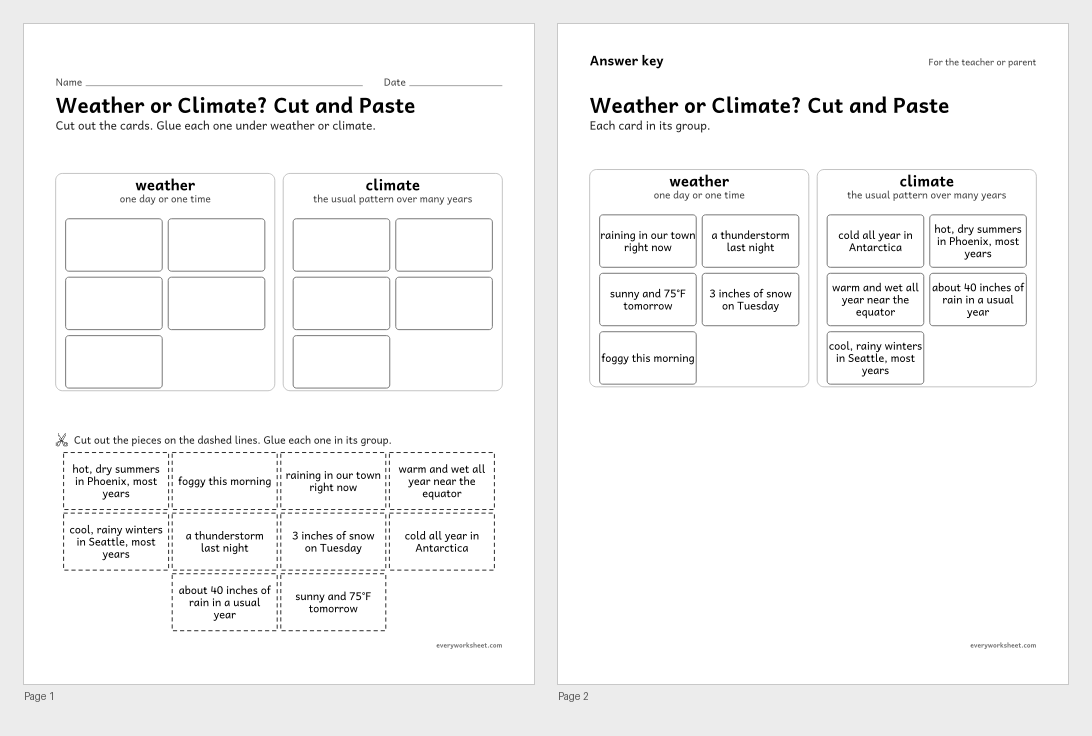
Sorting statements into weather (one time) and climate (the usual pattern over many years)
Answer key on page 2
2 pages64 KB
 View all 2 pages
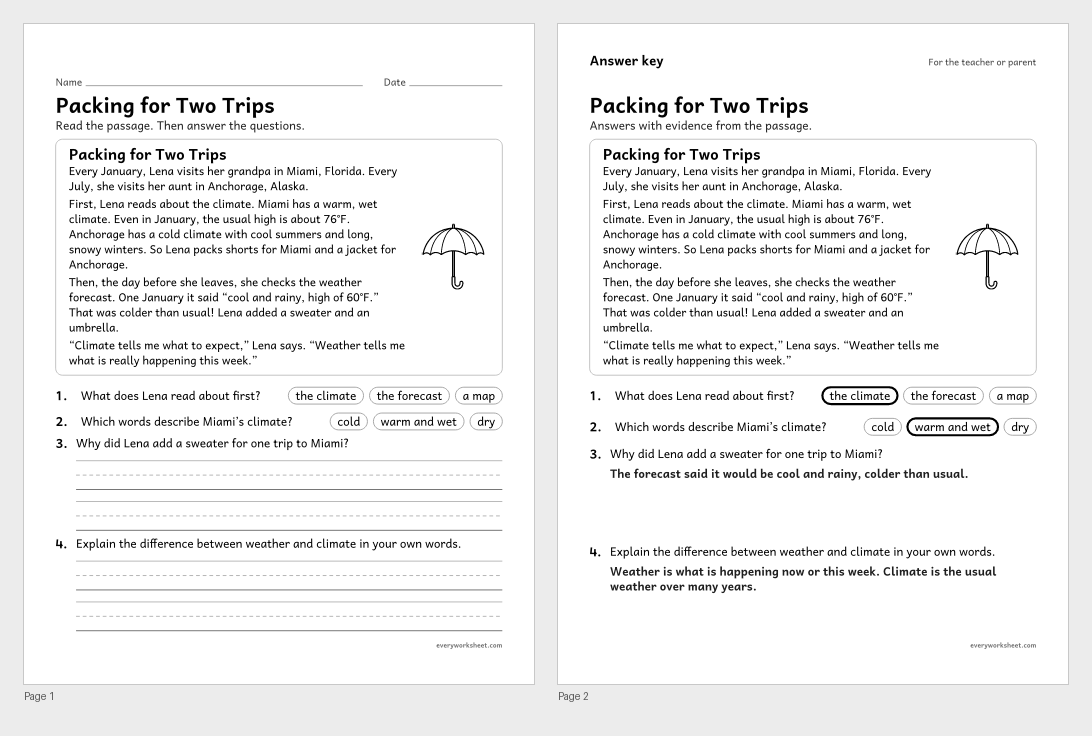
Reading an informational passage to explain the difference between weather and climate
Answer key on page 2
2 pages46 KB
 View all 2 pages
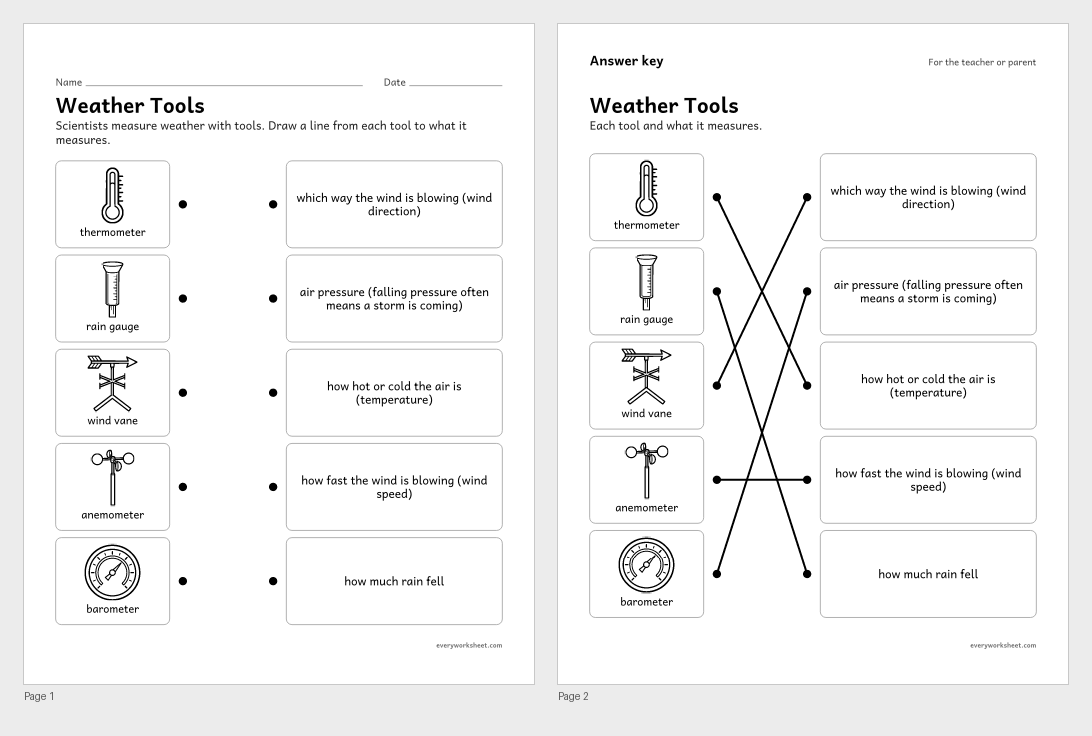
Matching weather tools to what they measure
Answer key on page 2
2 pages190 KB
 View all 2 pages
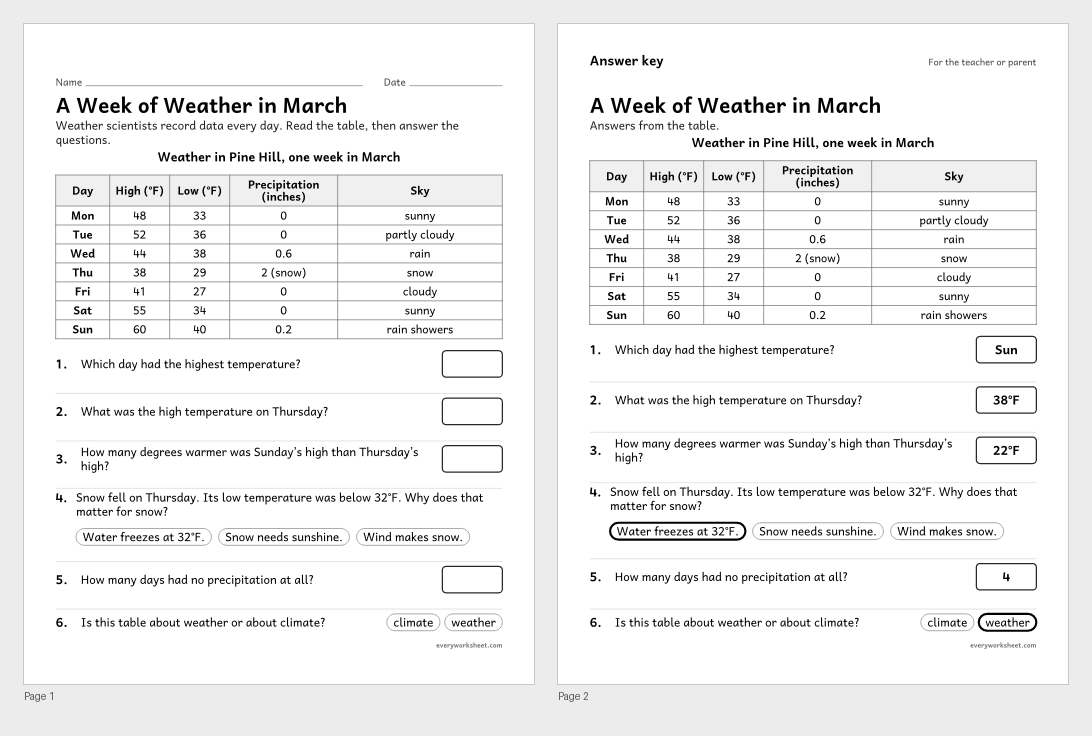
Reading a table of daily weather data and describing the weather it shows
Answer key on page 2
2 pages59 KB
 View all 2 pages
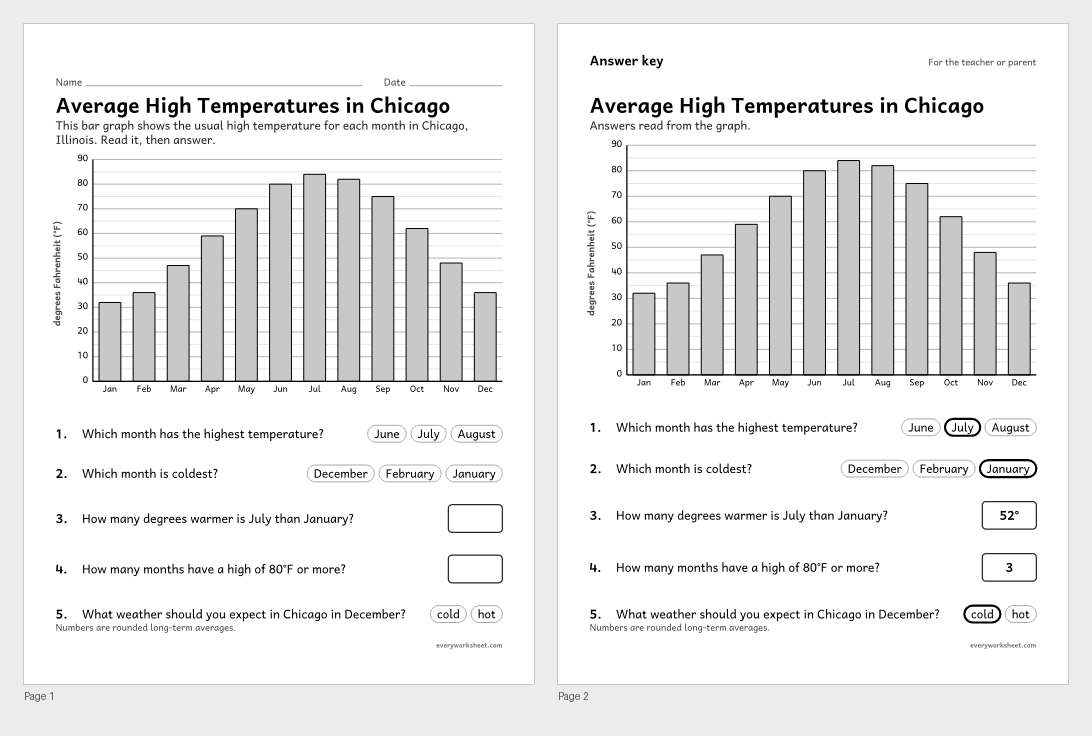
Reading a scaled bar graph of monthly temperatures to describe the weather expected in each season
Answer key on page 2
2 pages42 KB
 View all 2 pages
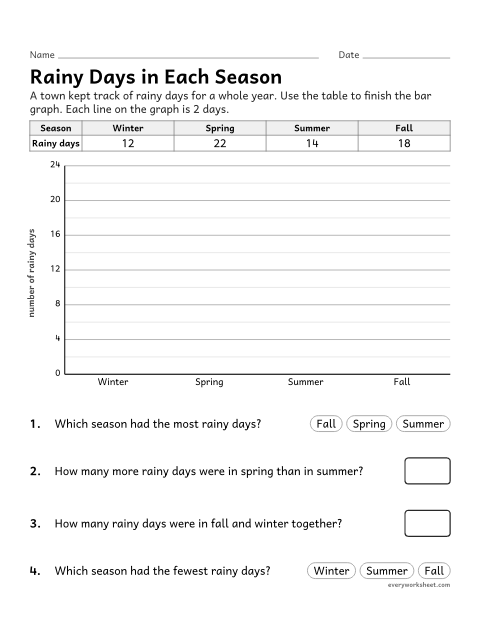
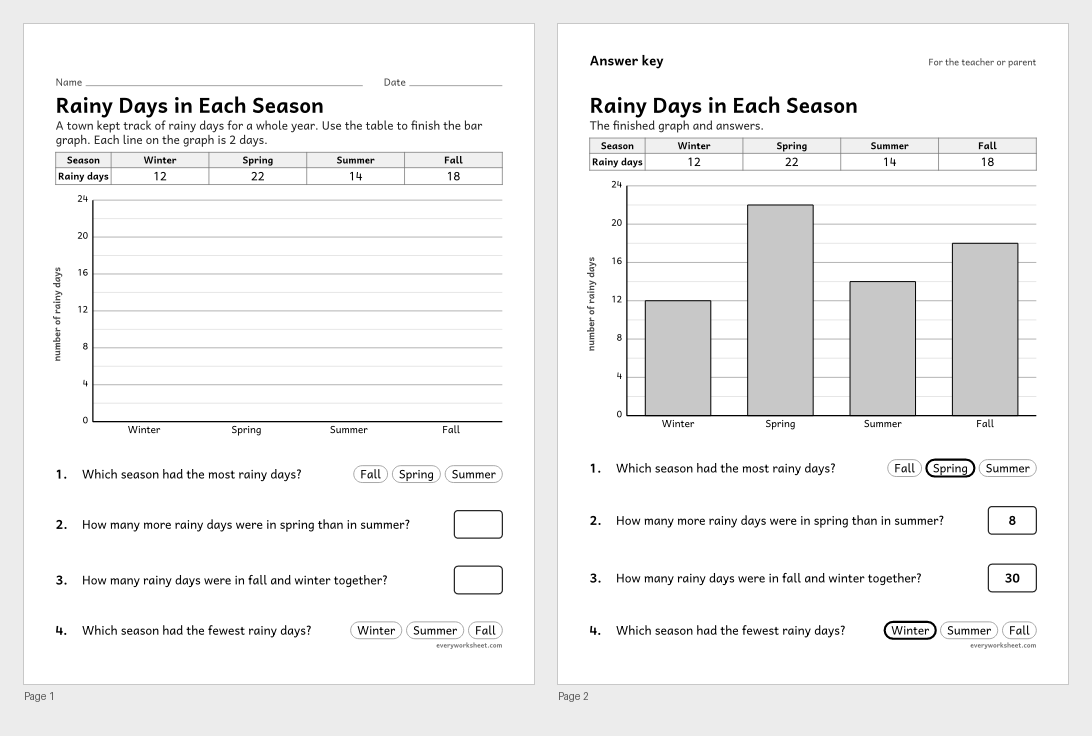
Making a scaled bar graph of weather data by season and solving how-many-more problems
Answer key on page 2
2 pages43 KB
 View all 2 pages
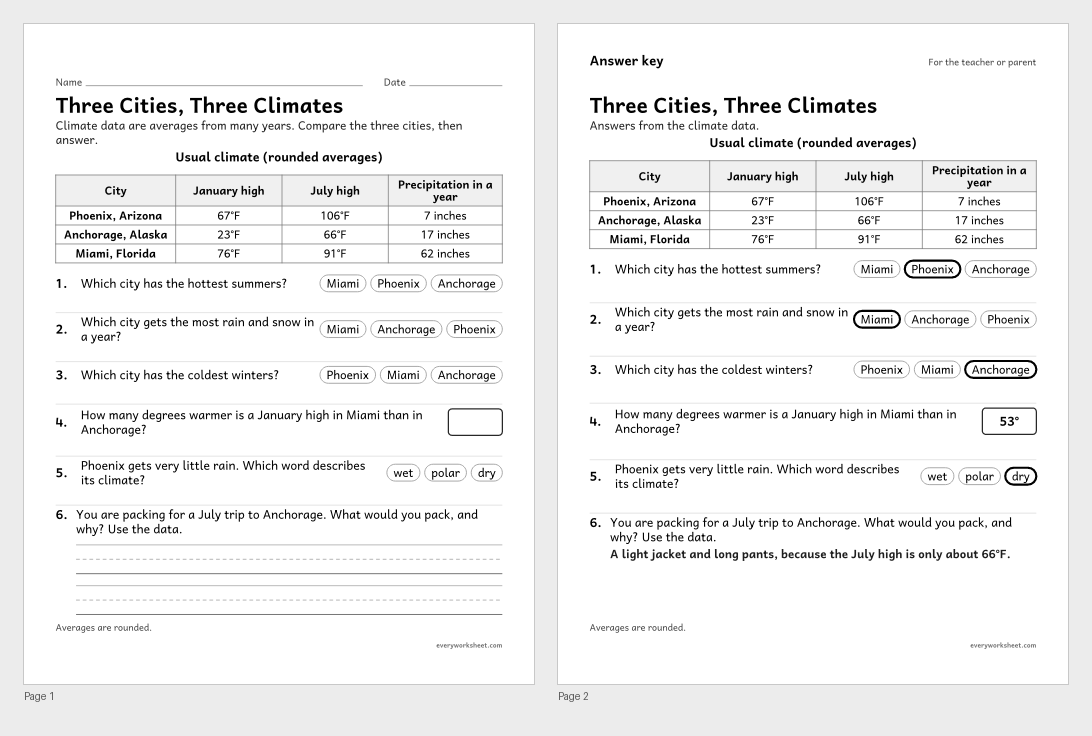
Using climate data to describe and compare the climates of different places
Answer key on page 2
2 pages50 KB
 View larger
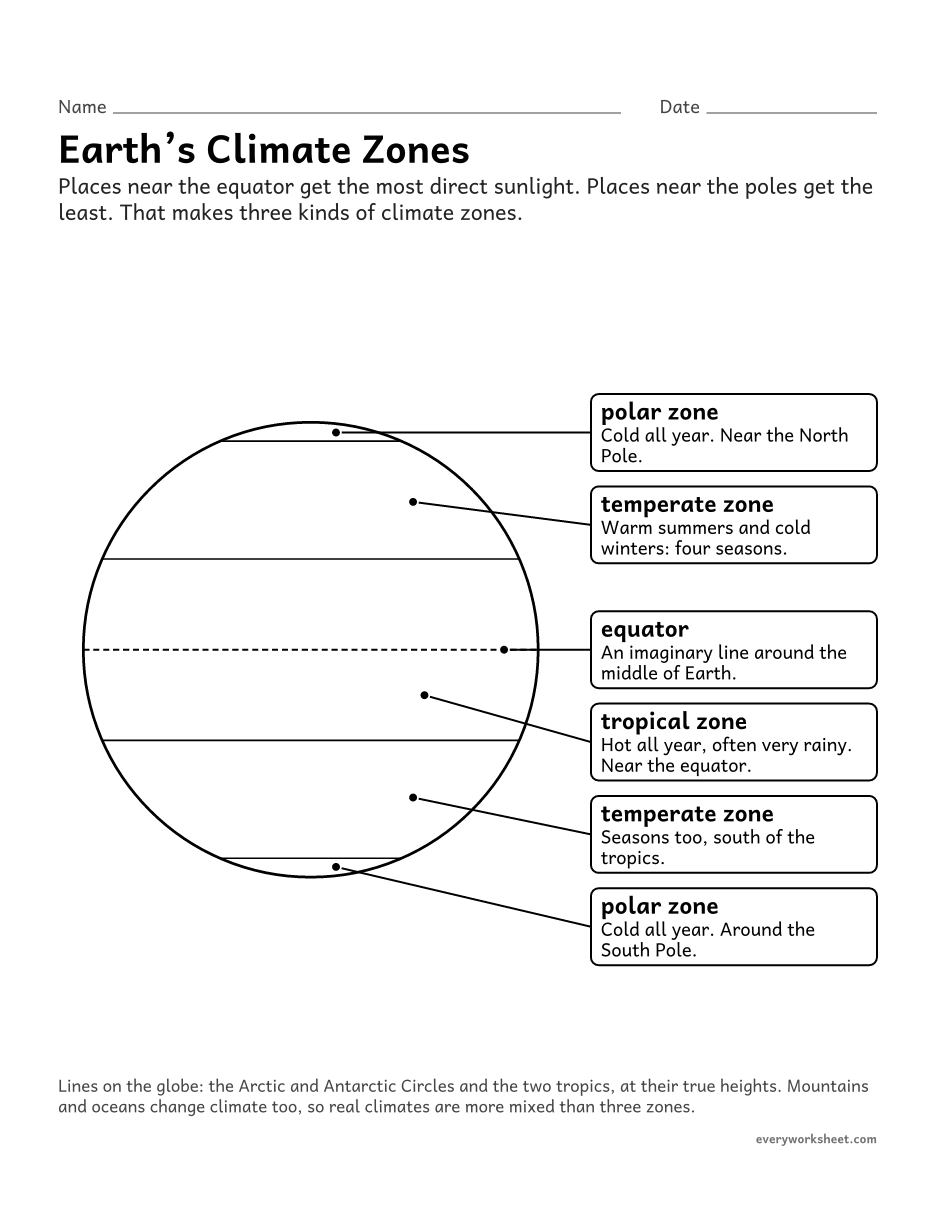
Describing the polar, temperate and tropical climate zones and where they are
1 page29 KB
 View all 2 pages
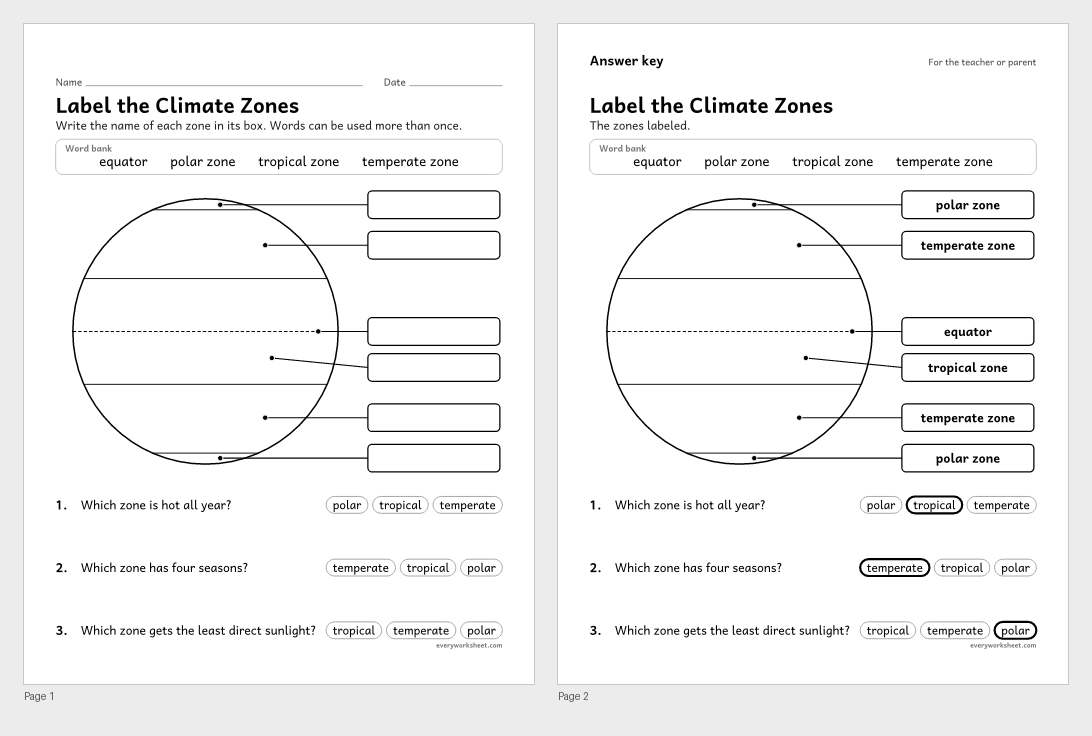
Labeling the polar, temperate and tropical climate zones on a globe
Answer key on page 2
2 pages35 KB
 View all 2 pages
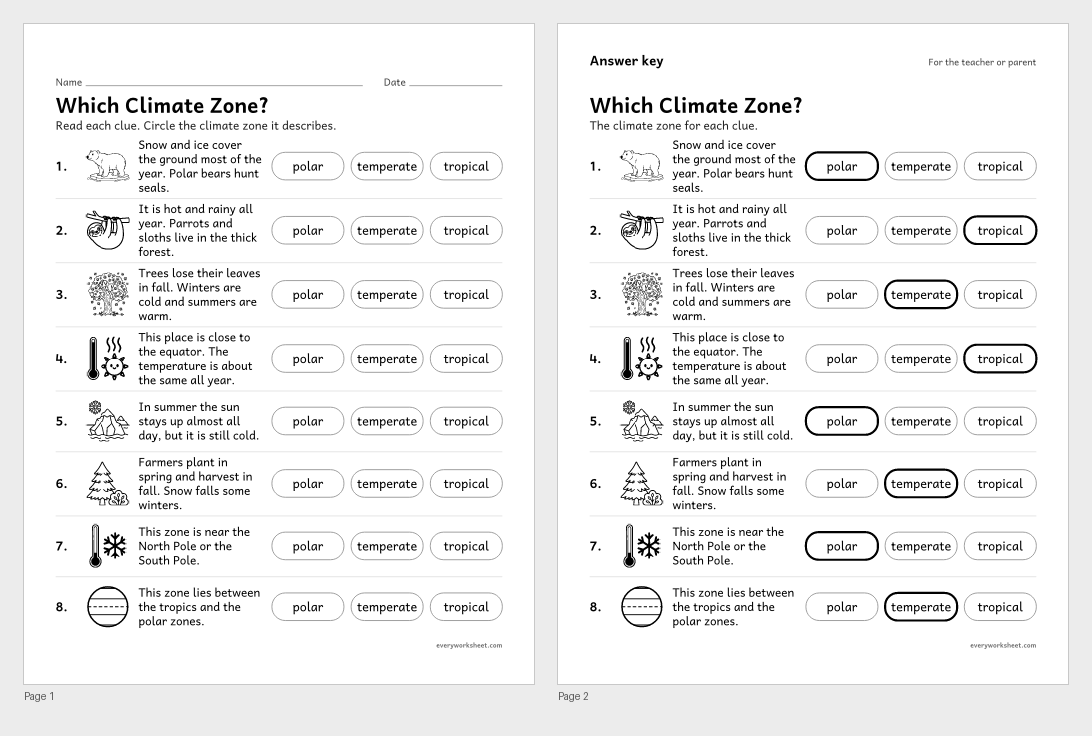
Using clues about weather, plants and animals to name a place’s climate zone
Answer key on page 2
2 pages352 KB
 View larger
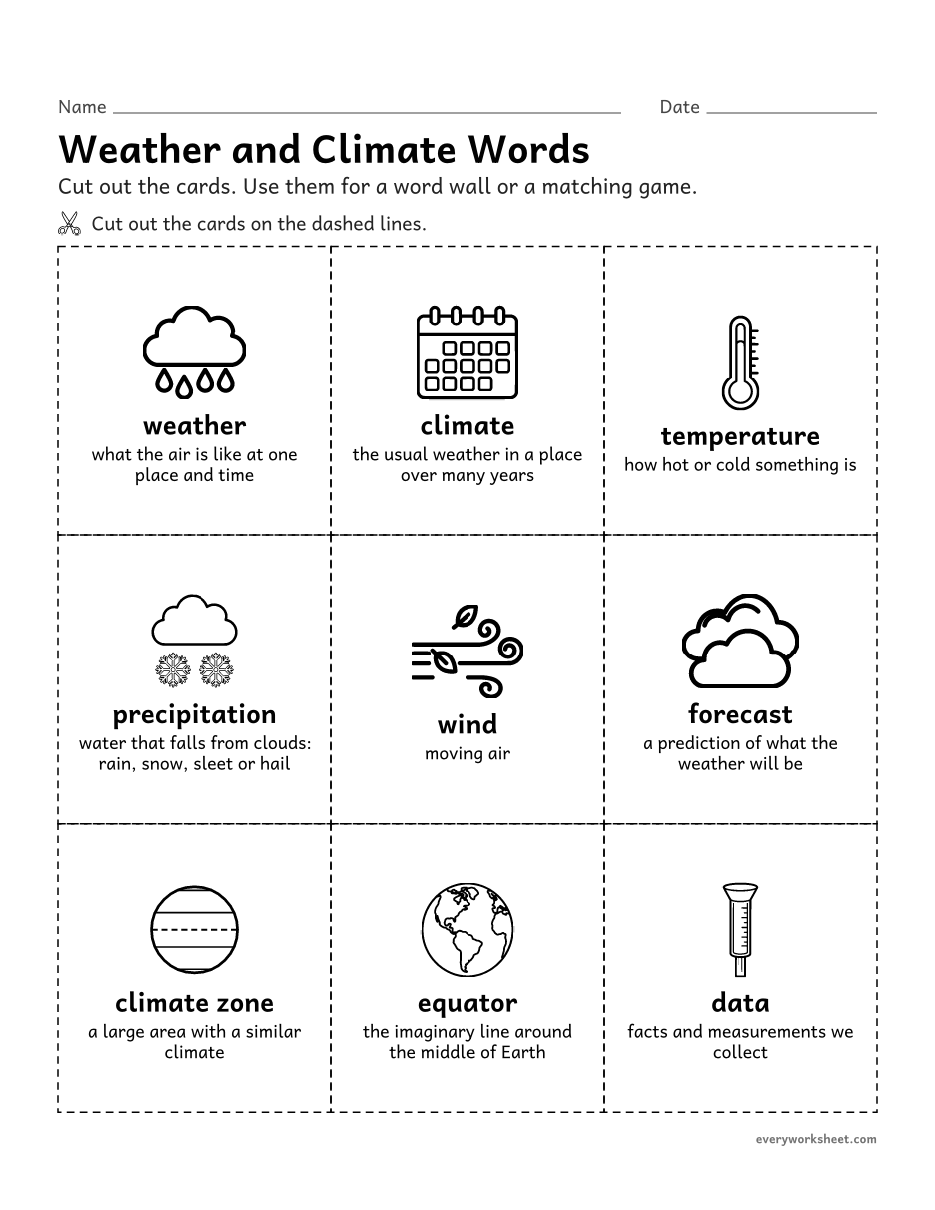
Learning the vocabulary of weather and climate
1 page109 KB
 View all 2 pages
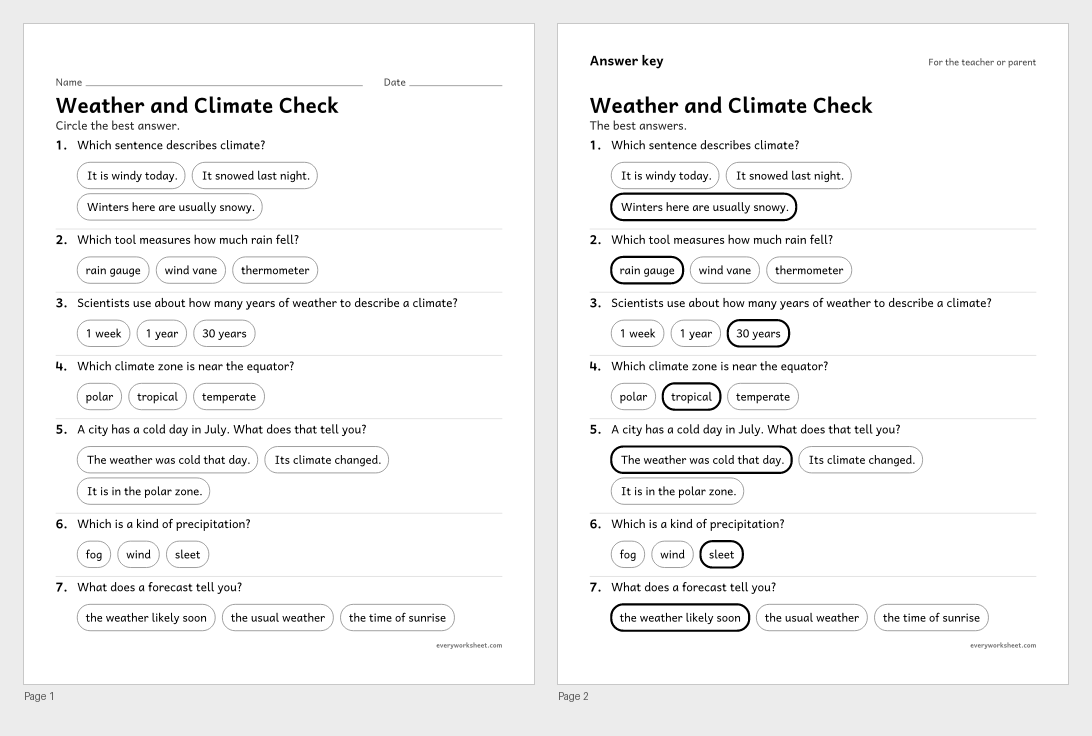
Reviewing weather, climate, weather tools and climate zones
Answer key on page 2
2 pages41 KB
Print at 100% (actual size) for the cleanest tracing lines.
Weather is what the air is doing today. Climate is the weather a place usually has, year after year. Third graders learn to tell the two apart, then use real data to describe the weather to expect in each season and the climates of places around the world.
These weather and climate worksheets start with a poster and a weather-or-climate sort, move on to weather tools and data tables, and then put the data to work: a bar graph of monthly temperatures, a rainy-days graph to finish, a comparison of three U.S. cities and a globe of the polar, temperate and tropical zones.
Every page is black and white, prints on US Letter or A4, and every page with right answers has an answer key on page 2.
NGSS 3-ESS2-2Obtain and combine information to describe climates in different regions of the world.NGSS 3-ESS2-1Represent data in tables and graphical displays to describe typical weather conditions expected during a particular season.CCSS.ELA-LITERACY.RI.3.1Ask and answer questions to demonstrate understanding of a text, referring explicitly to the text as the basis for the answers.CCSS.ELA-LITERACY.RI.3.4Determine the meaning of general academic and domain-specific words and phrases in a text relevant to a grade 3 topic or subject area.CCSS.MATH.CONTENT.3.MD.B.3Draw a scaled picture graph and a scaled bar graph to represent a data set with several categories. Solve one- and two-step “how many more” and “how many less” problems using information presented in scaled bar graphs. For example, draw a bar graph in which each square in the bar graph might represent 5 pets.Weather is the condition of the air at one place and time, like rainy and 58°F today. Climate is the usual pattern of weather in a place over many years, like hot, dry summers.
Most 3rd grade lessons use three zones: tropical (hot all year, near the equator), temperate (four seasons) and polar (cold all year, near the poles). Many also talk about dry, desert climates.
A thermometer measures temperature, a rain gauge measures rainfall, a wind vane shows wind direction, an anemometer measures wind speed and a barometer measures air pressure.
Yes. The Chicago, Phoenix, Anchorage and Miami numbers are rounded long-term averages. The week of weather and the rainy-days data are made up for practice.