 View all 2 pages
Read a line plot
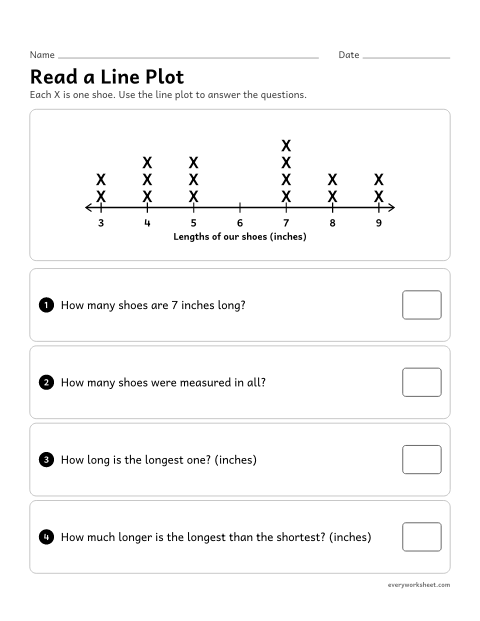
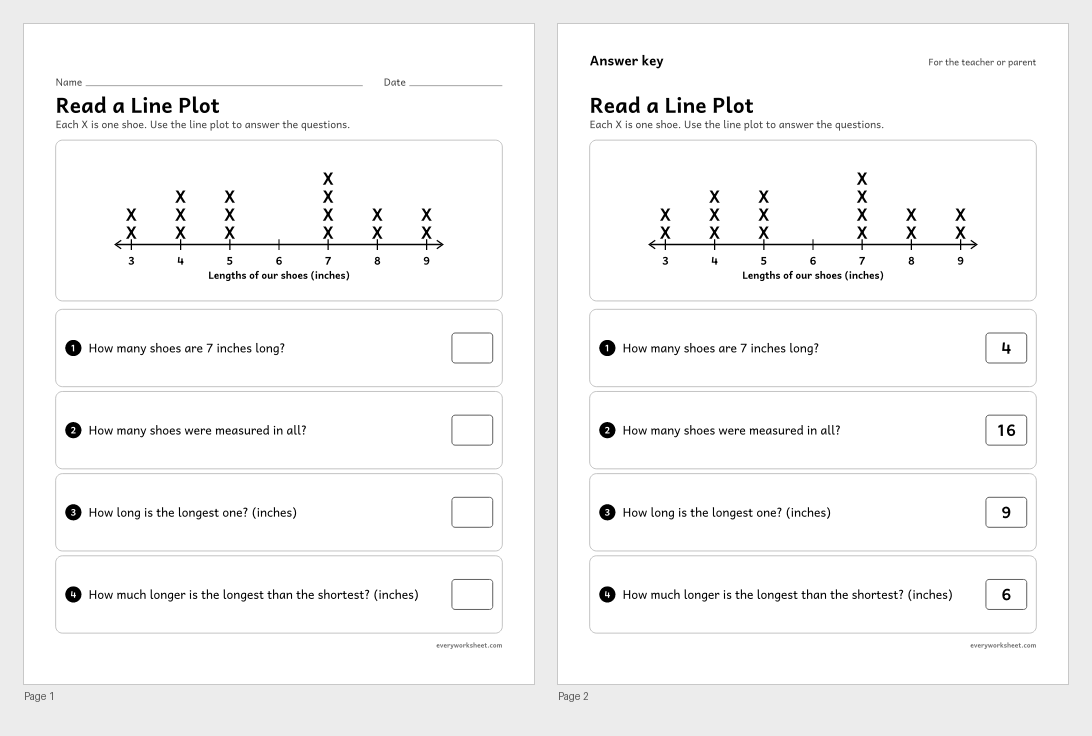
Reading a line plot of lengths in whole inches
Answer key on page 2
2 pages36 KB
Read and make line plots, from whole-number lengths in 2nd grade to fractions of an inch in 4th and 5th grade, with answer keys.
View all 2 pagesReading a line plot of lengths in whole inches
Answer key on page 2
2 pages36 KB
 View all 2 pages
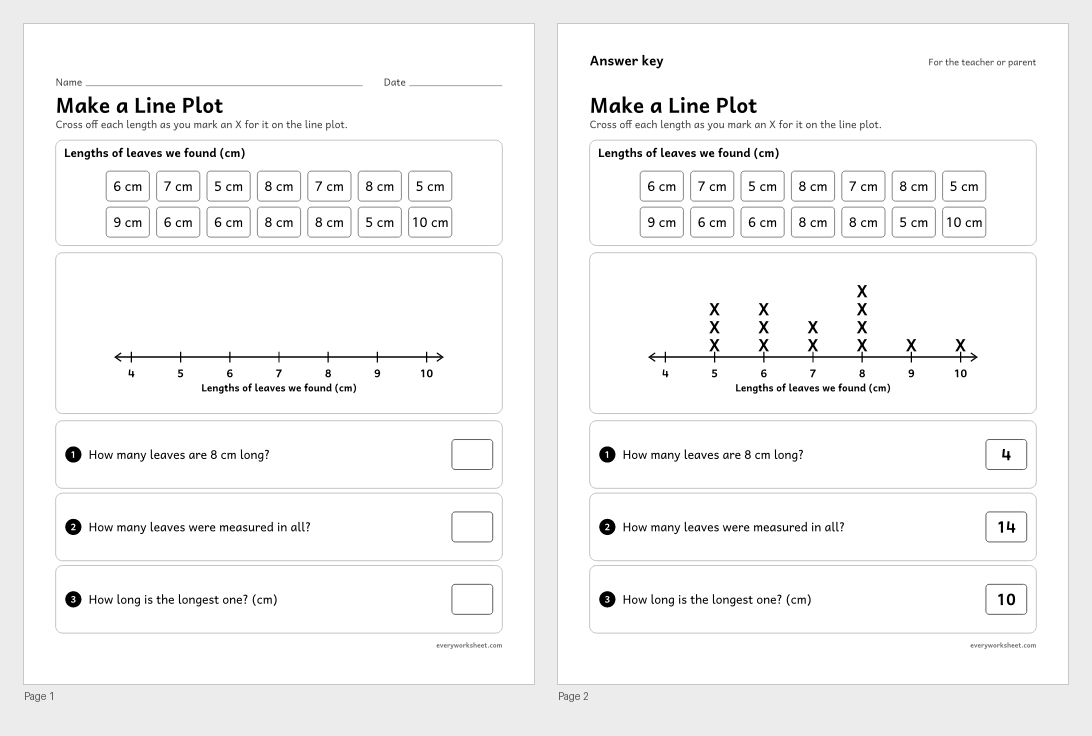
Making a line plot from a list of measurements
Answer key on page 2
2 pages43 KB
 View all 2 pages
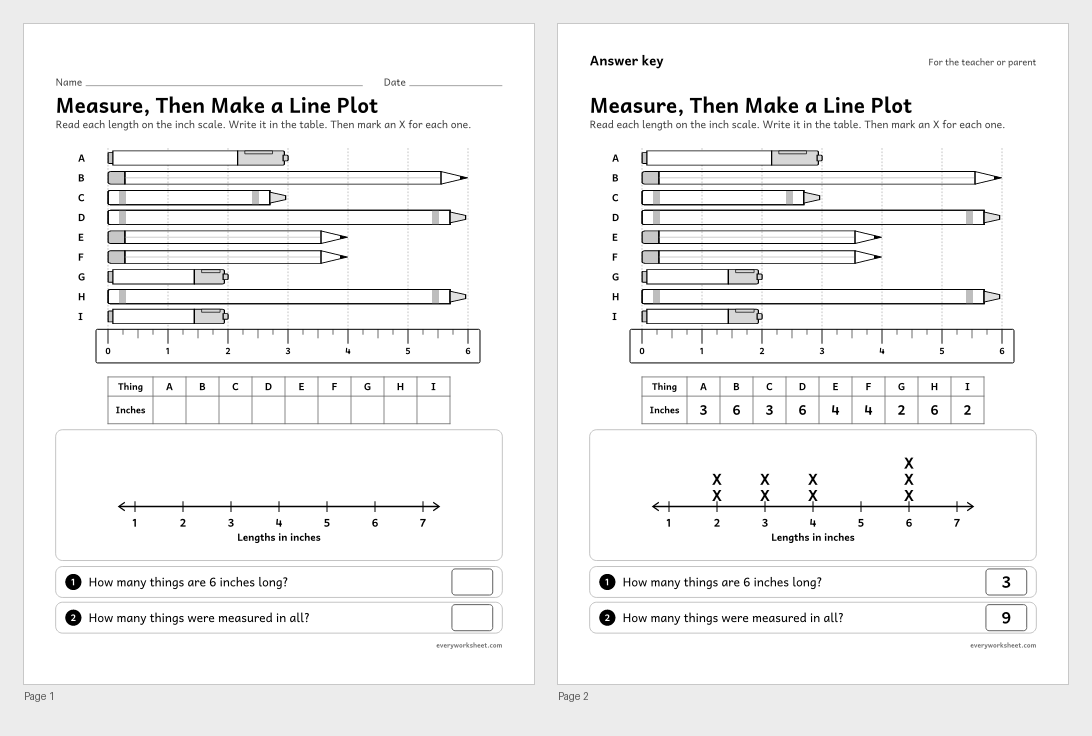
Measuring objects to the nearest inch and showing the data on a line plot
Answer key on page 2
2 pages46 KB
 View all 2 pages
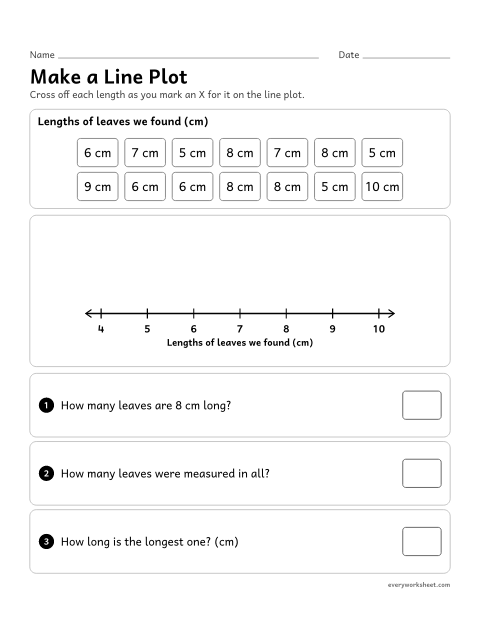
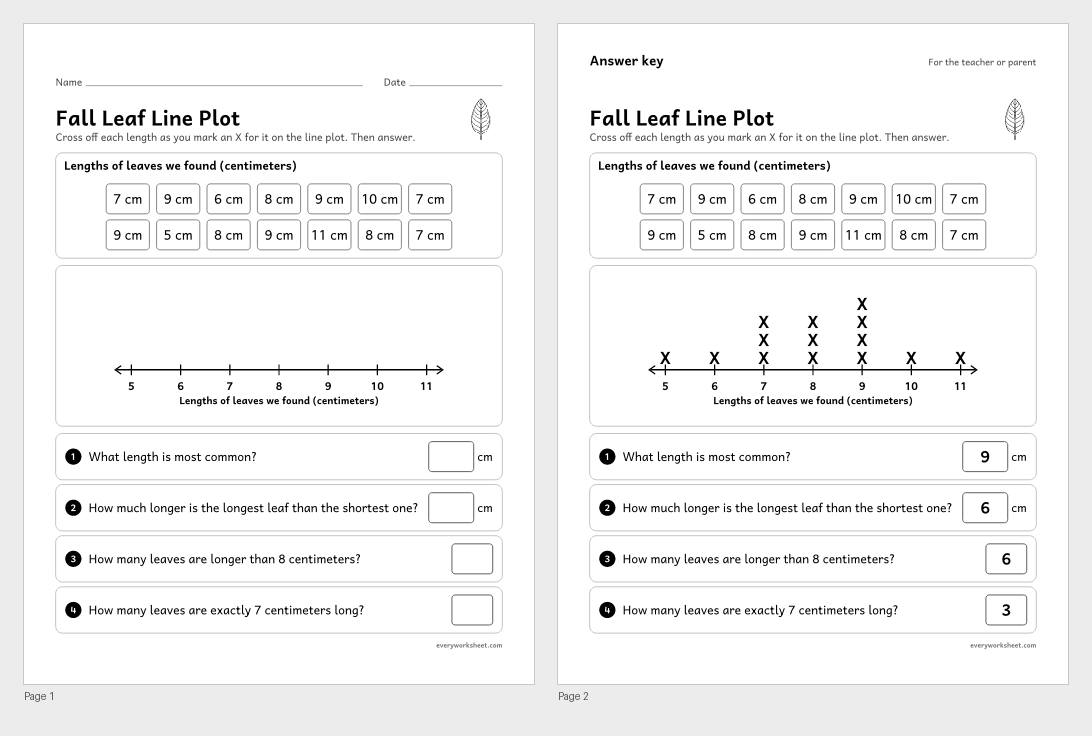
Showing leaf lengths on a line plot and answering questions about the data
Answer key on page 2
2 pages54 KB
 View all 2 pages
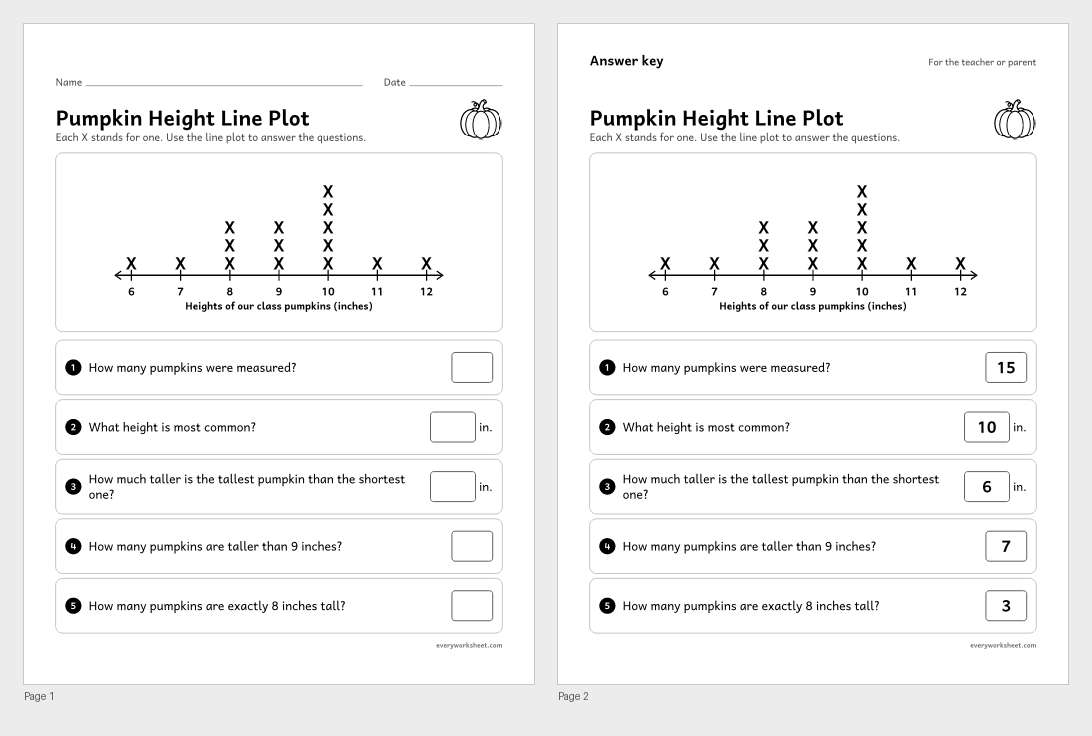
Reading a line plot of pumpkin heights in inches
Answer key on page 2
2 pages88 KB
 View all 2 pages
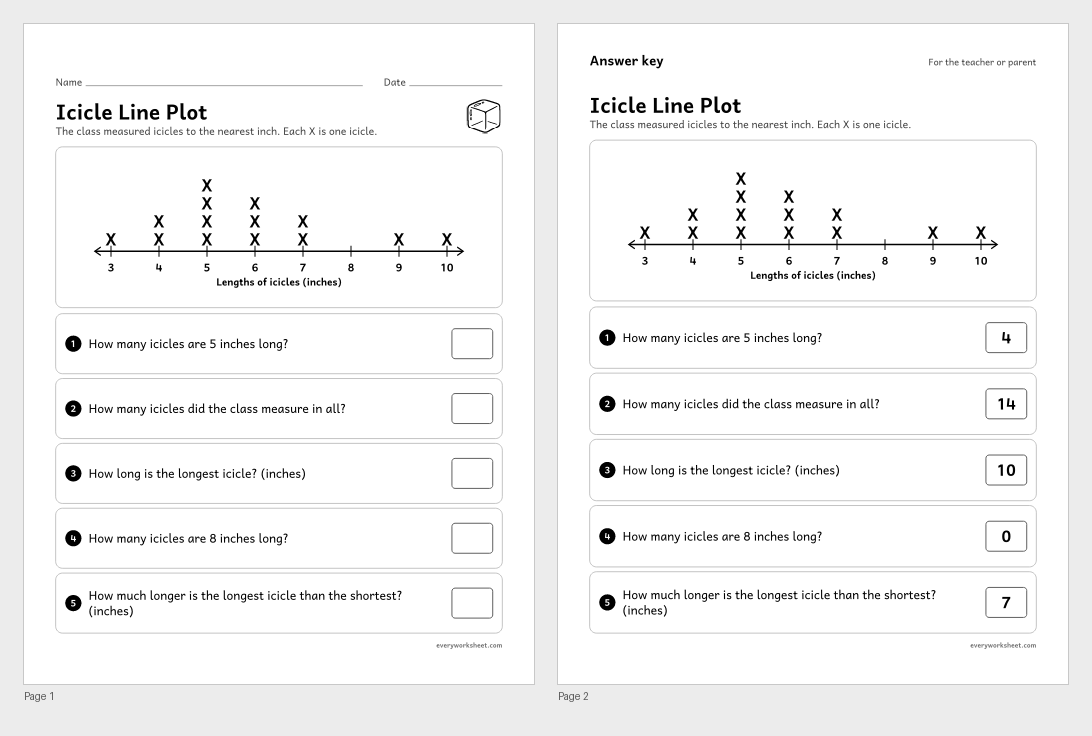
Reading a line plot of measured lengths in whole inches
Answer key on page 2
2 pages56 KB
 View all 2 pages
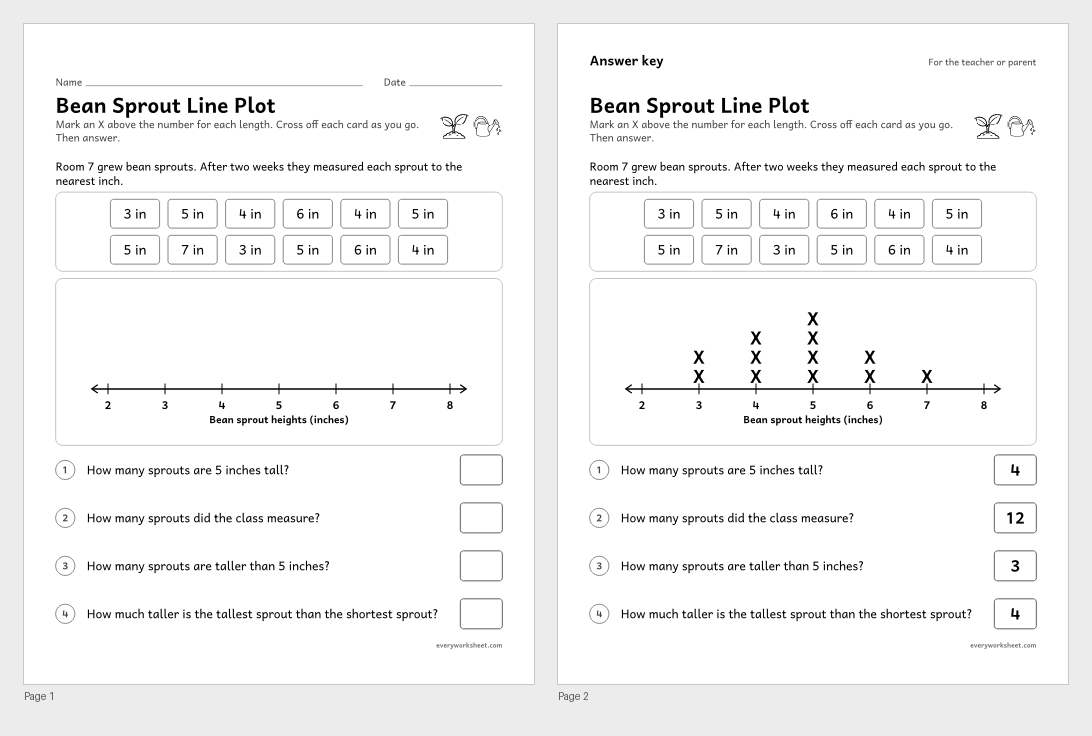
Making a line plot of measured lengths in whole inches
Answer key on page 2
2 pages77 KB
 View all 2 pages
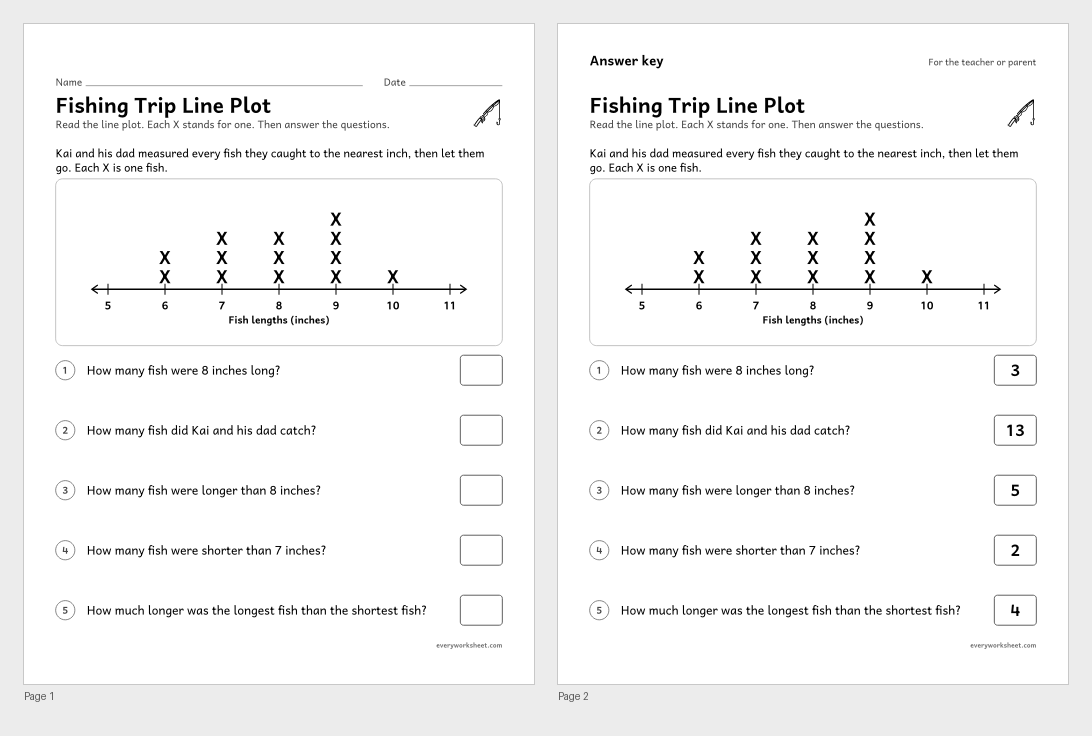
Reading a line plot of lengths in whole inches
Answer key on page 2
2 pages69 KB
 View all 2 pages
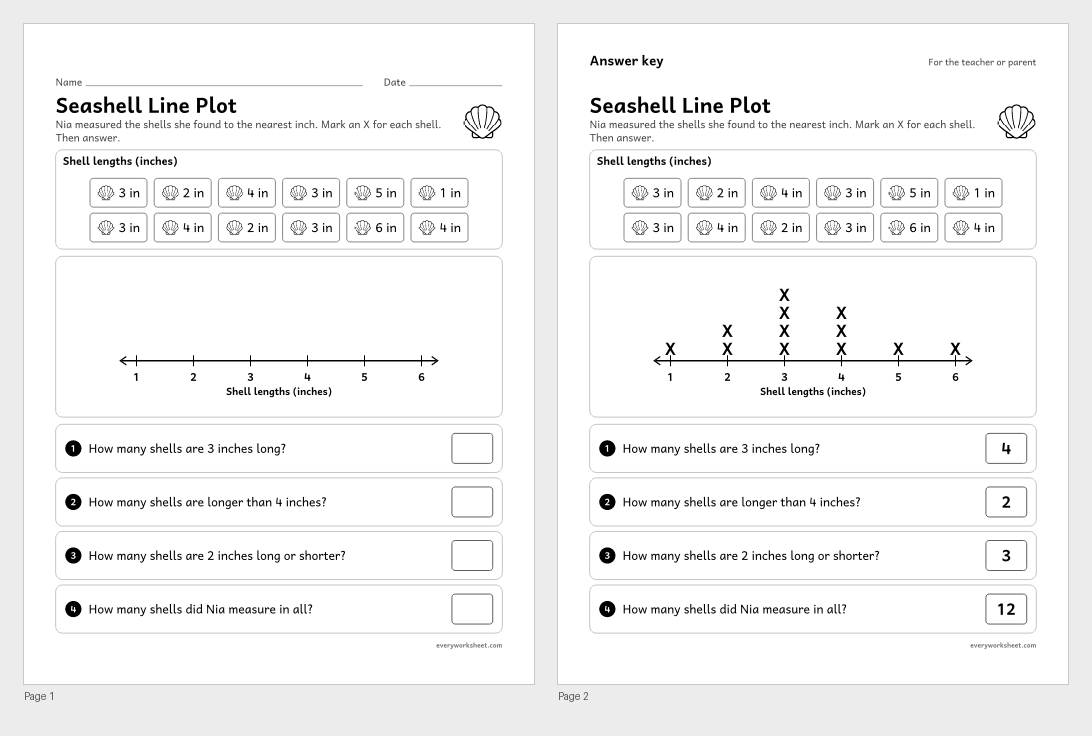
Making a line plot of measured lengths and answering questions about it
Answer key on page 2
2 pages594 KB
 View all 2 pages
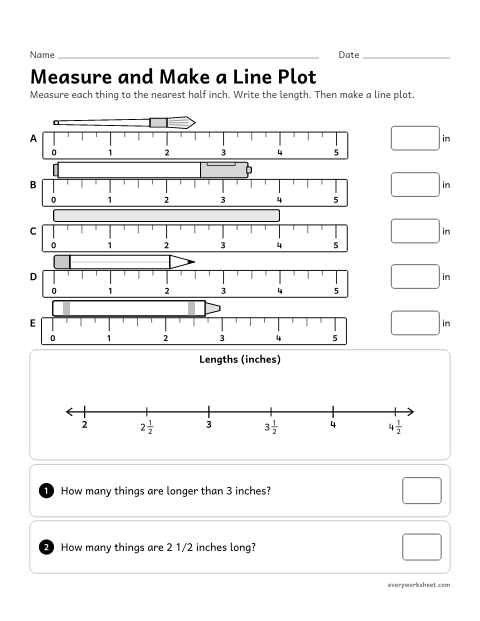
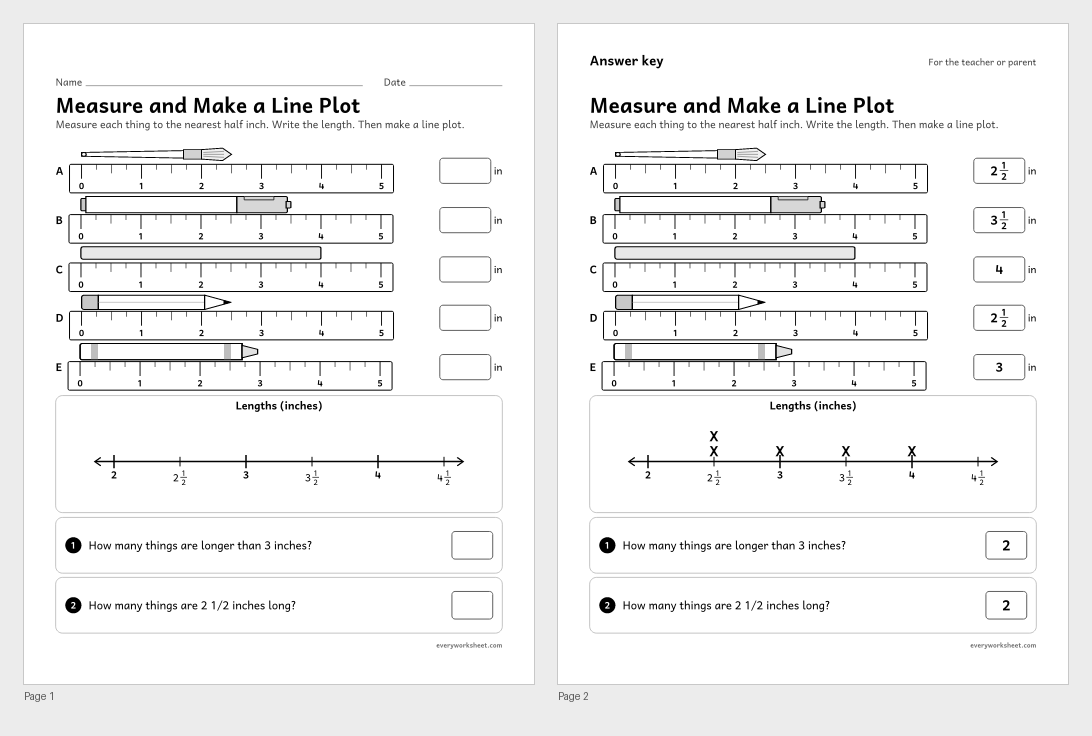
Measuring things to the nearest half inch and showing the lengths on a line plot
Answer key on page 2
2 pages47 KB
 View all 2 pages
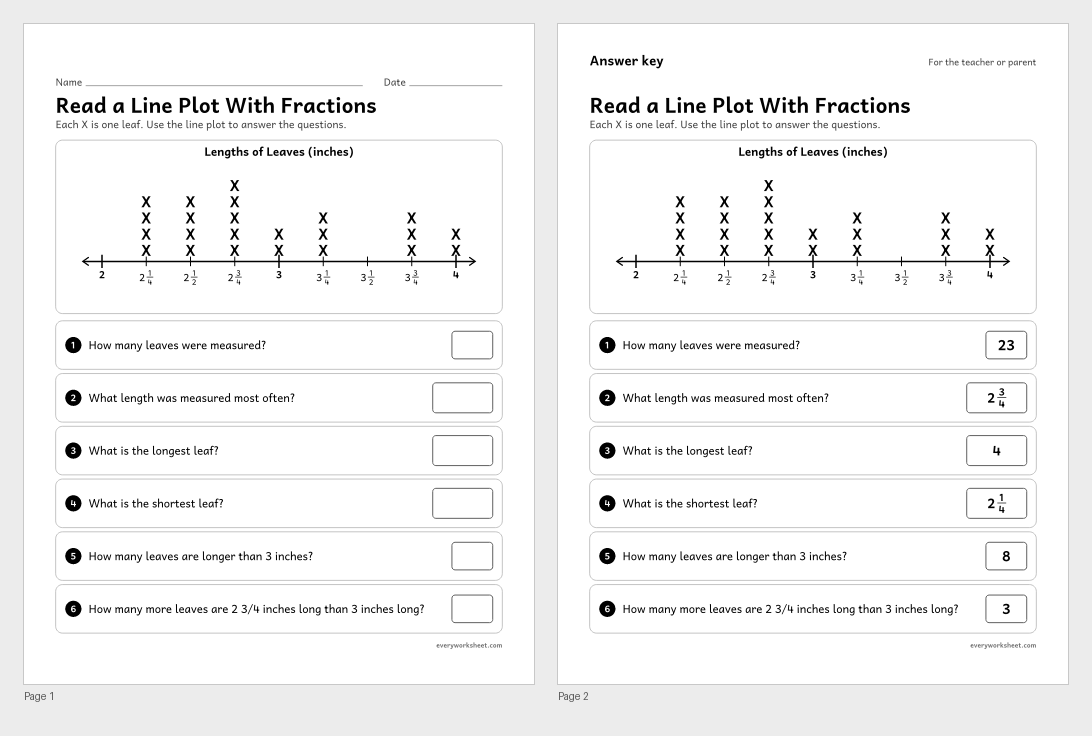
Reading a line plot of lengths marked in quarter inches
Answer key on page 2
2 pages41 KB
 View all 2 pages
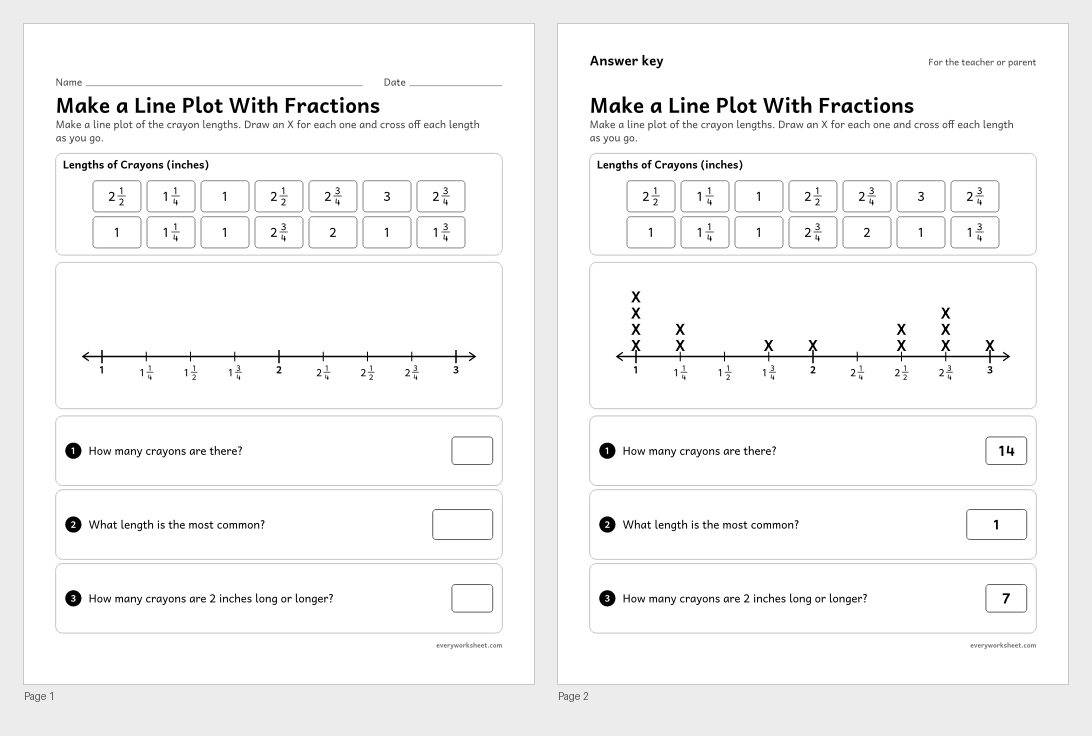
Making a line plot from lengths in whole, half and quarter inches
Answer key on page 2
2 pages44 KB
 View all 2 pages
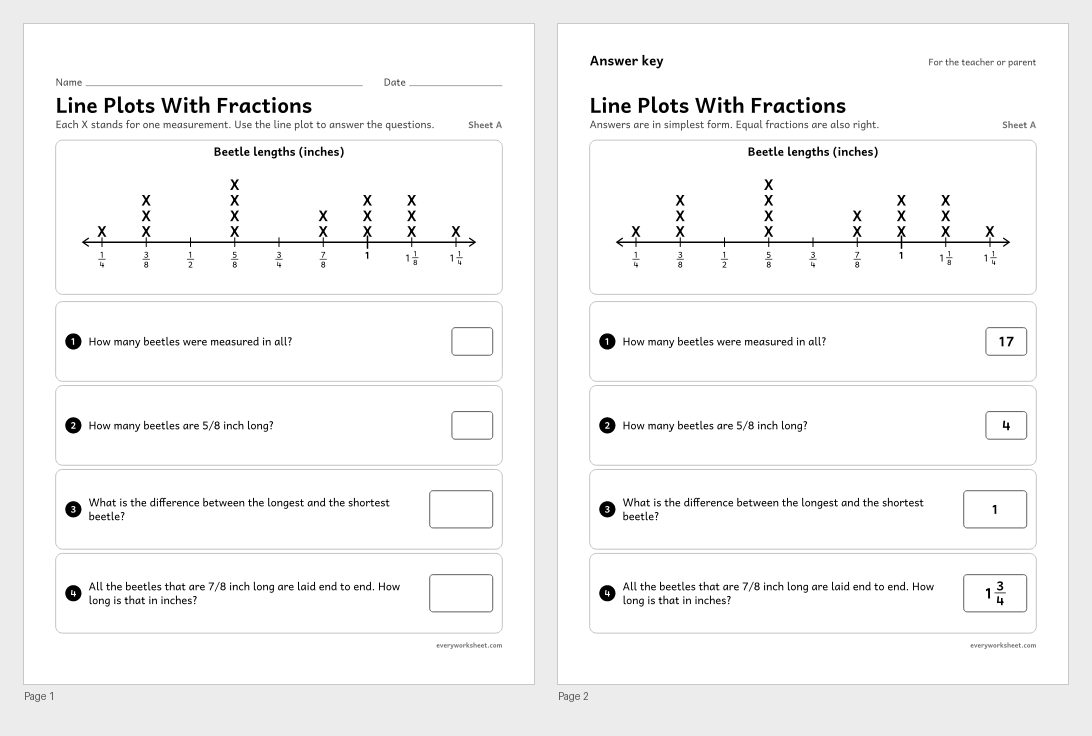
Reading a line plot in eighths of an inch and adding and subtracting fractions to answer questions
Answer key on page 2
2 pages39 KB
 View all 2 pages
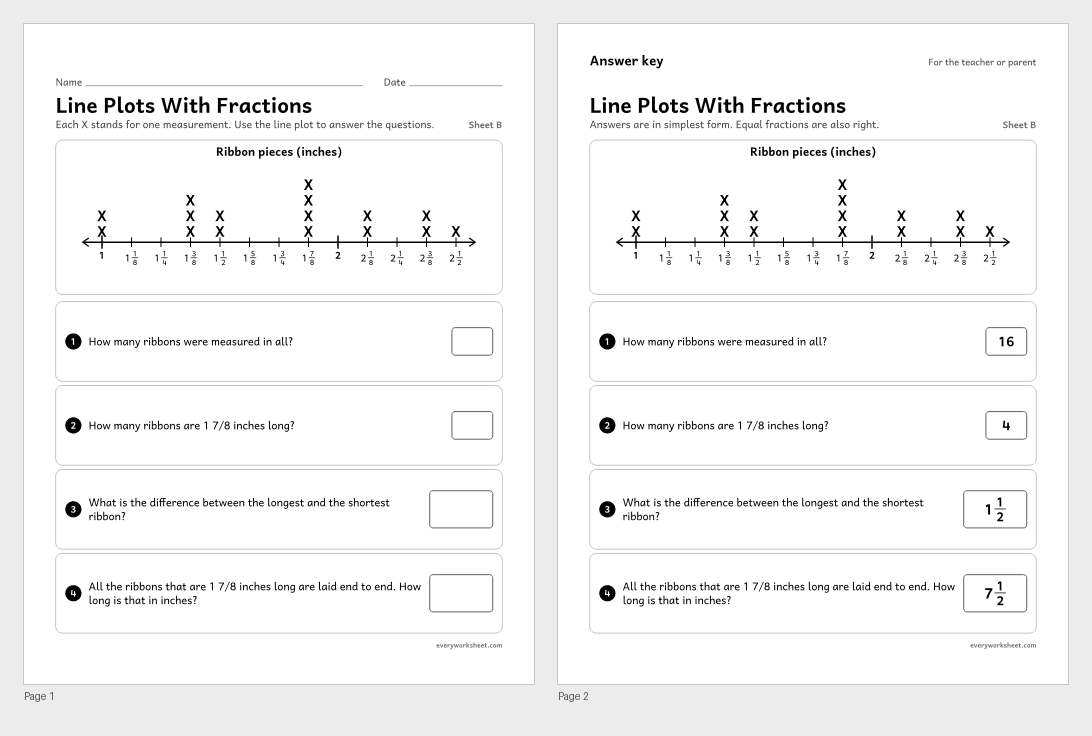
Reading a line plot from 1 to 2 1/2 inches in eighths and solving fraction problems
Answer key on page 2
2 pages40 KB
 View all 2 pages
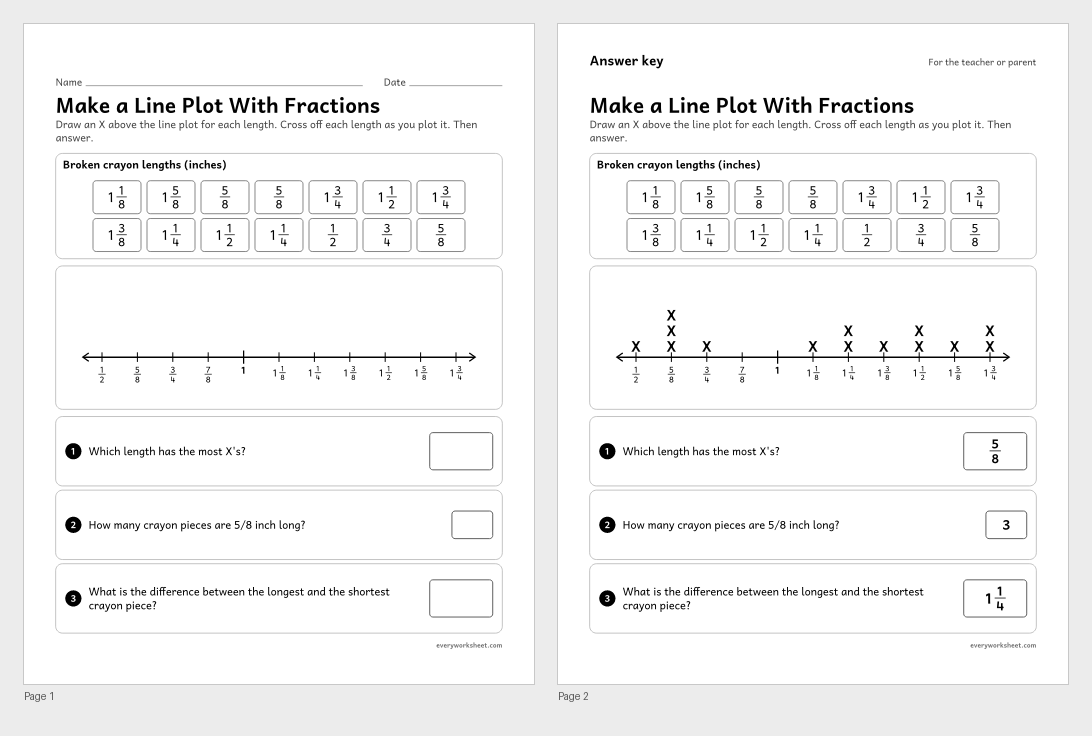
Making a line plot of lengths measured in halves, fourths and eighths of an inch
Answer key on page 2
2 pages46 KB
 View all 2 pages
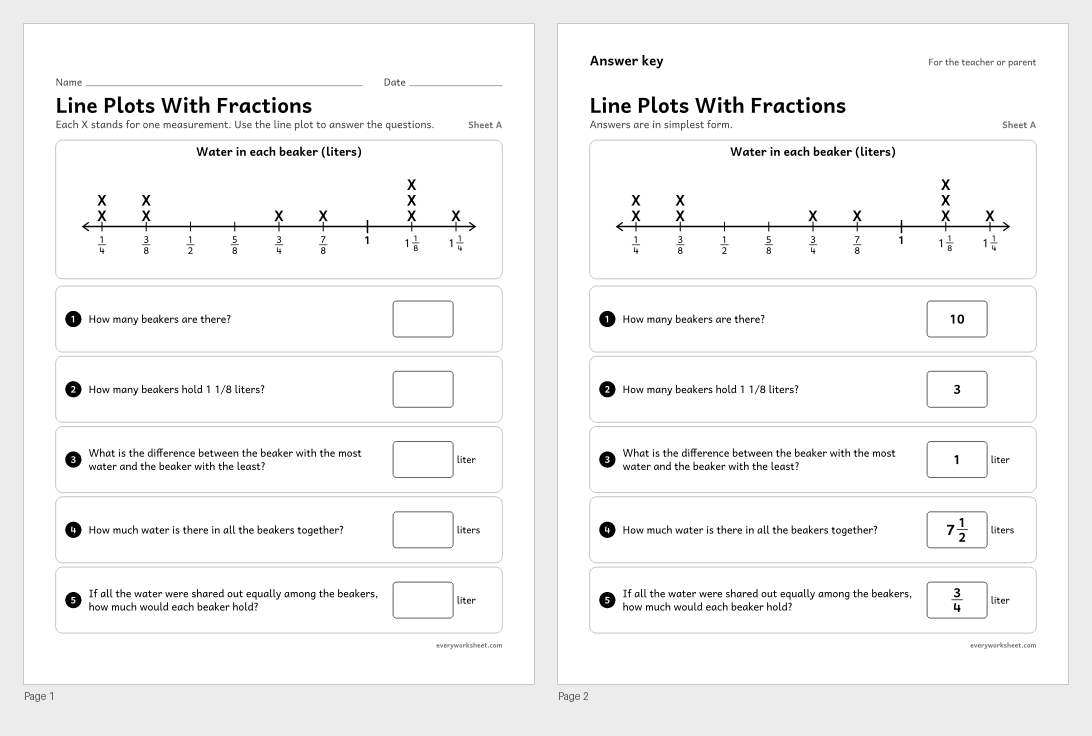
Reading a line plot of liters in eighths, then adding, subtracting and sharing the total equally
Answer key on page 2
2 pages41 KB
 View all 2 pages
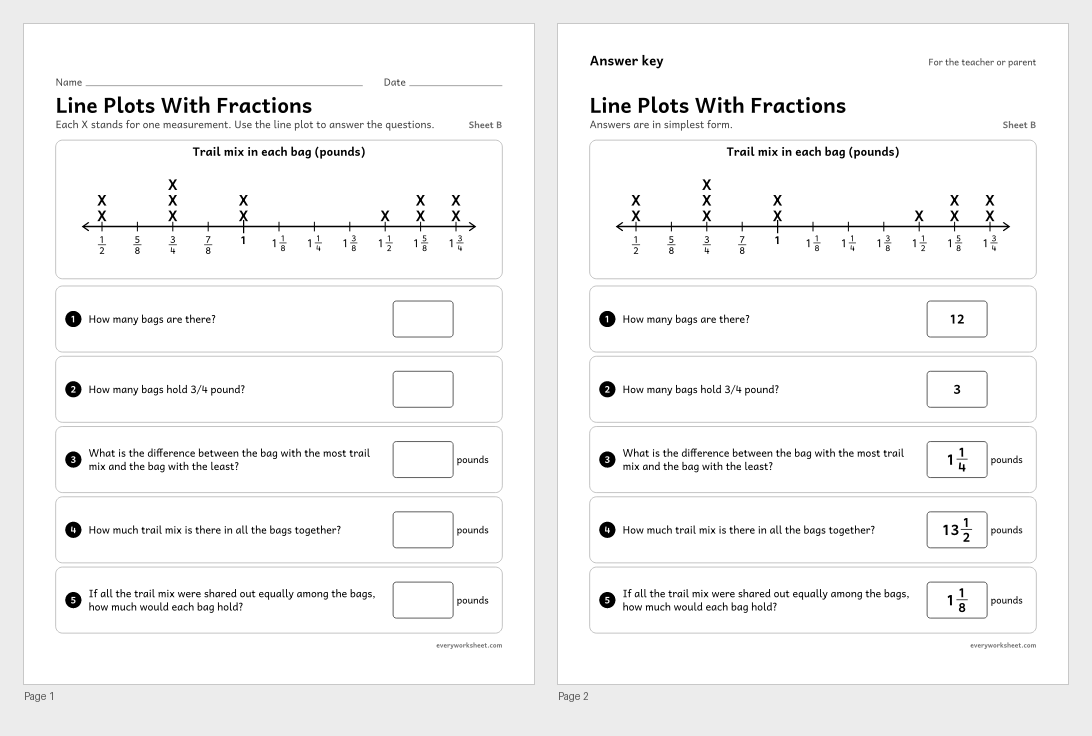
Reading a line plot of pounds in eighths and solving problems with fraction operations
Answer key on page 2
2 pages43 KB
 View all 2 pages
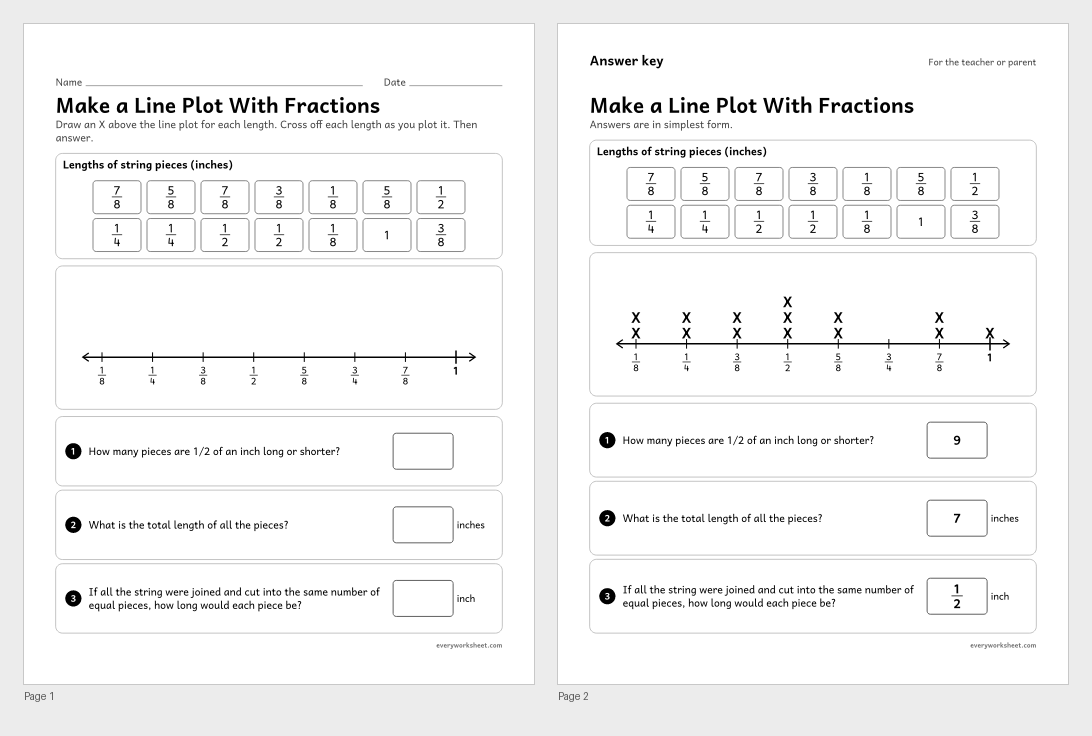
Making a line plot of measurements in halves, fourths and eighths of an inch, then adding and sharing the total
Answer key on page 2
2 pages45 KB
 View all 2 pages
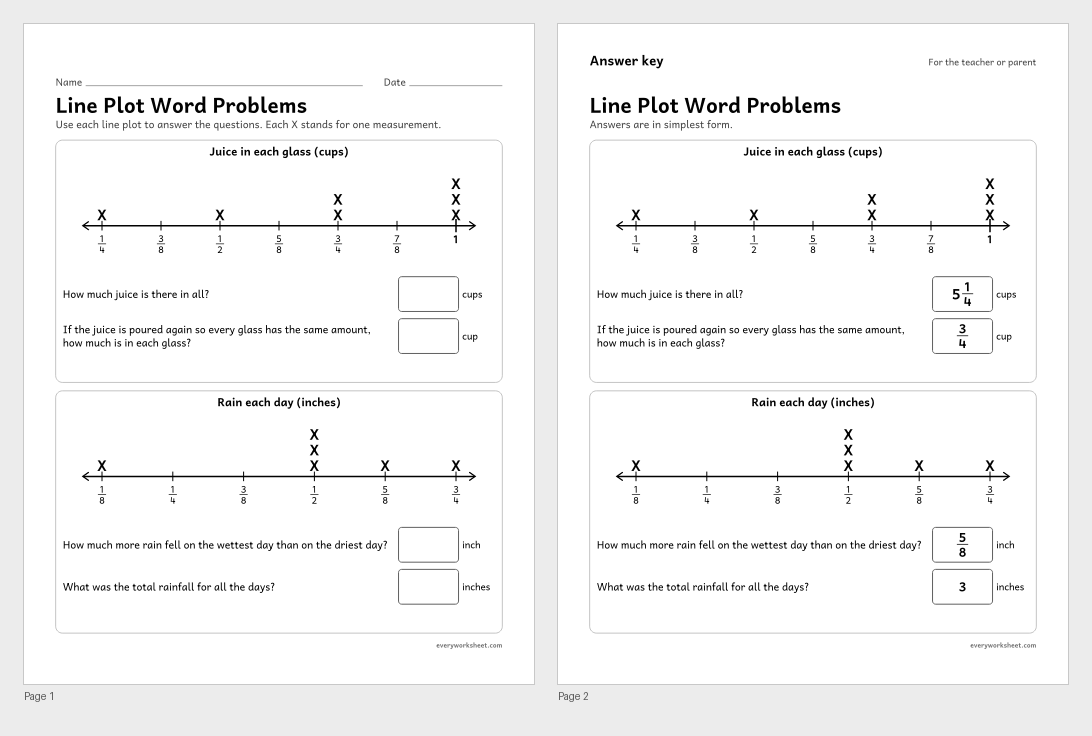
Solving word problems from line plots in eighths: totals, differences and sharing equally
Answer key on page 2
2 pages39 KB
Print at 100% (actual size) for the cleanest tracing lines.
A line plot shows data along a number line, with one X for each measurement. It makes it easy to see the most common value, the biggest and smallest, and how spread out the data is.
In 2nd grade children measure lengths in whole units and plot them. In 3rd grade the scale is marked in halves and fourths of an inch, and in 4th and 5th grade children use fractions to answer questions about the data.
Every sheet here prints in black and white on US Letter or A4, and the practice sheets have answer keys.
CCSS.MATH.CONTENT.2.MD.D.9Generate measurement data by measuring lengths of several objects to the nearest whole unit, or by making repeated measurements of the same object. Show the measurements by making a line plot, where the horizontal scale is marked off in whole-number units.CCSS.MATH.CONTENT.3.MD.B.4Generate measurement data by measuring lengths using rulers marked with halves and fourths of an inch. Show the data by making a line plot, where the horizontal scale is marked off in appropriate units— whole numbers, halves, or quarters.CCSS.MATH.CONTENT.4.MD.B.4Make a line plot to display a data set of measurements in fractions of a unit (1/2, 1/4, 1/8). Solve problems involving addition and subtraction of fractions by using information presented in line plots. For example, from a line plot find and interpret the difference in length between the longest and shortest specimens in an insect collection.CCSS.MATH.CONTENT.5.MD.B.2Make a line plot to display a data set of measurements in fractions of a unit (1/2, 1/4, 1/8). Use operations on fractions for this grade to solve problems involving information presented in line plots. For example, given different measurements of liquid in identical beakers, find the amount of liquid each beaker would contain if the total amount in all the beakers were redistributed equally.A line plot is a number line with an X above it for each piece of data. It shows how often each value appears.
A line plot shows how many times each value appears, with Xs over a number line. A line graph shows how something changes over time, with points joined by lines.