 View all 2 pages
Tally marks
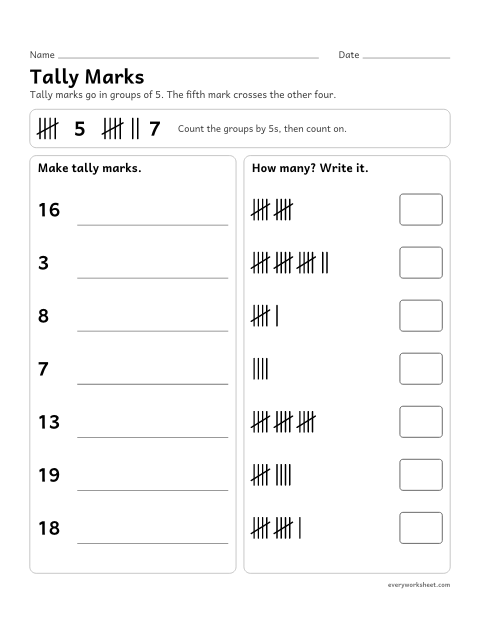
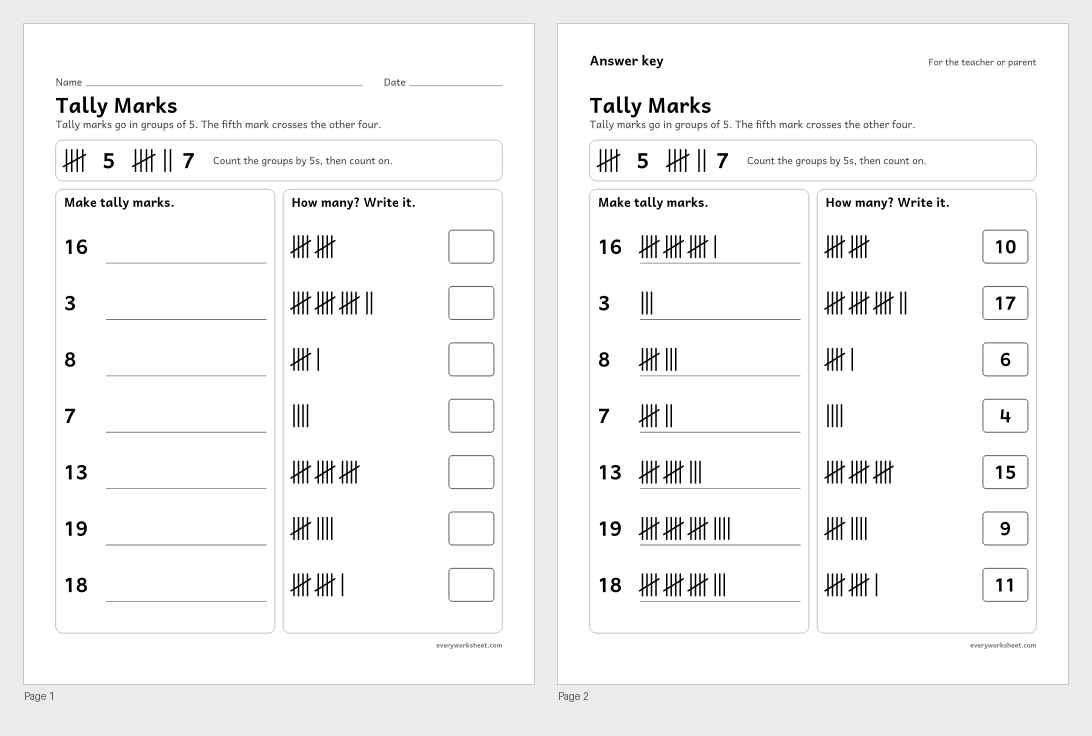
Writing numbers as tally marks in groups of five, and reading tallies
Answer key on page 2
2 pages43 KB
Data pages for 1st grade: tally marks, read and make tally charts, picture graphs and bar graphs with three groups, answer questions, and take a class survey.
View all 2 pagesWriting numbers as tally marks in groups of five, and reading tallies
Answer key on page 2
2 pages43 KB
 View all 2 pages
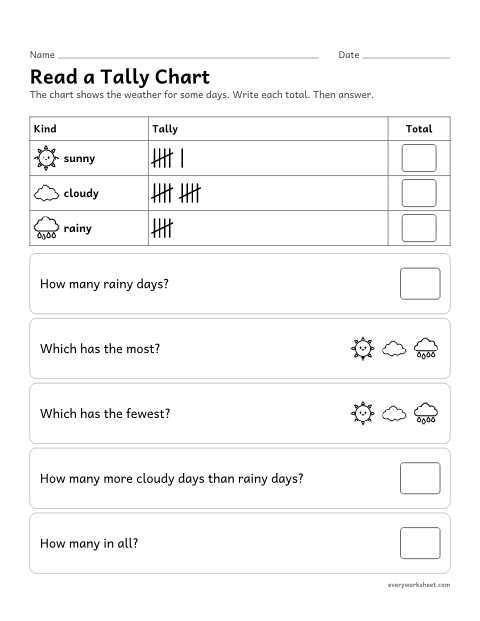
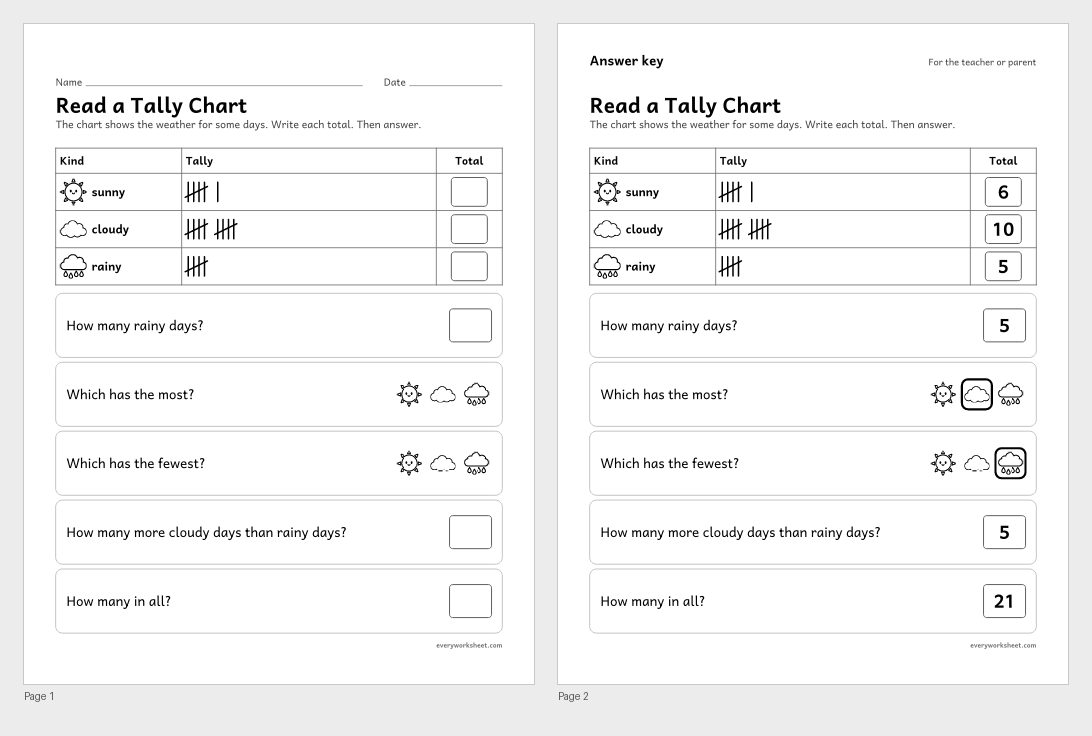
Reading a tally chart with three categories and answering questions
Answer key on page 2
2 pages130 KB
 View all 2 pages
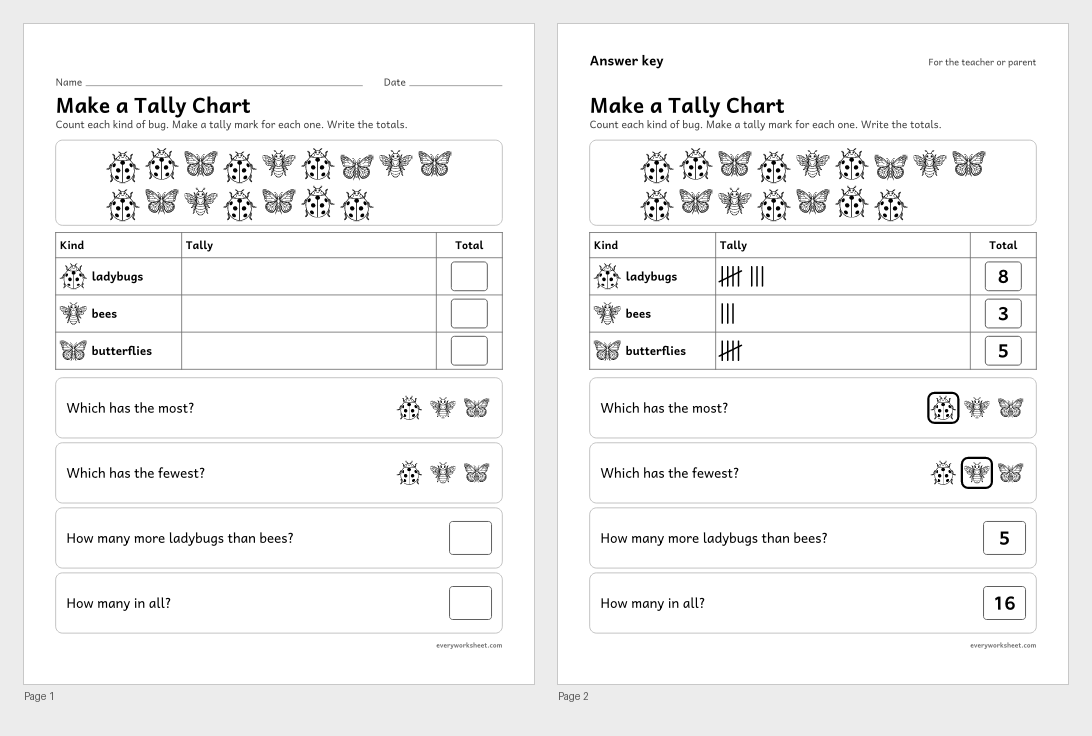
Counting pictures into a tally chart, then answering questions
Answer key on page 2
2 pages864 KB
 View all 2 pages
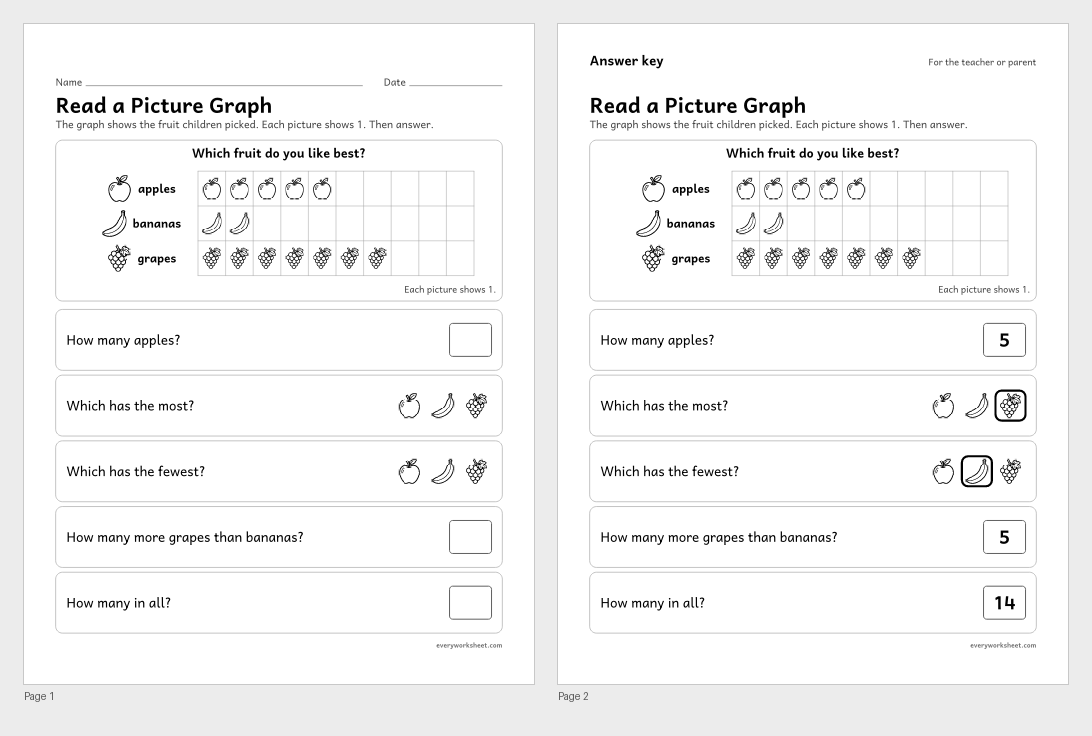
Reading a picture graph with three categories
Answer key on page 2
2 pages944 KB
 View all 2 pages
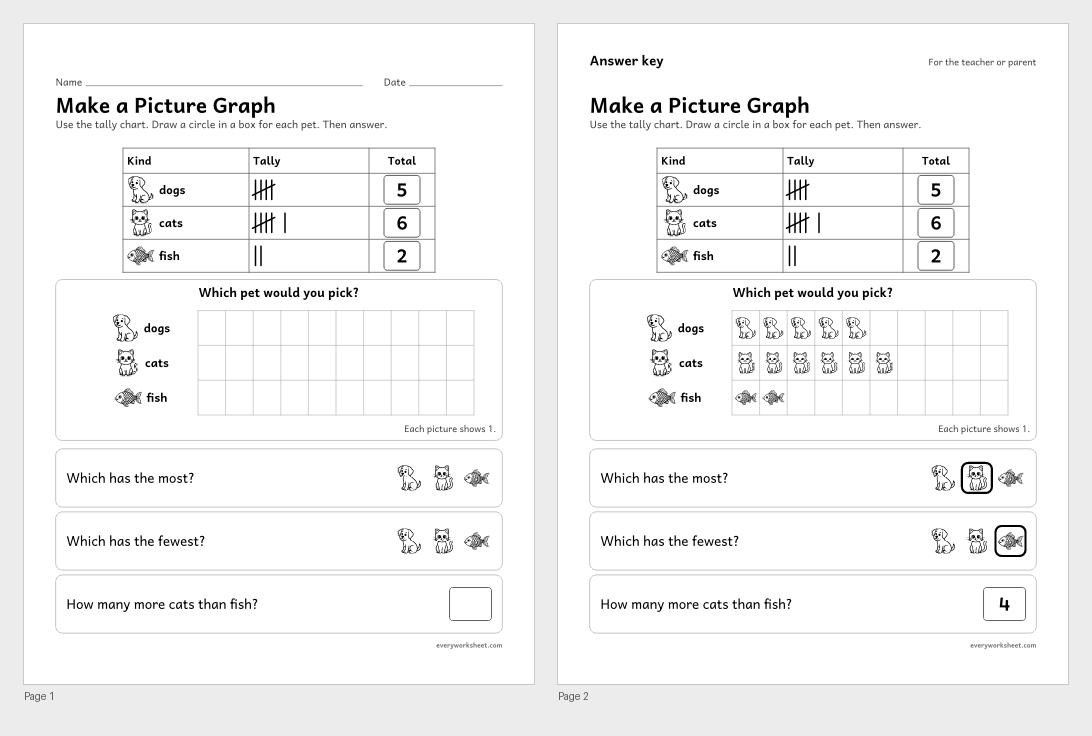
Making a picture graph from a tally chart
Answer key on page 2
2 pages672 KB
 View all 2 pages
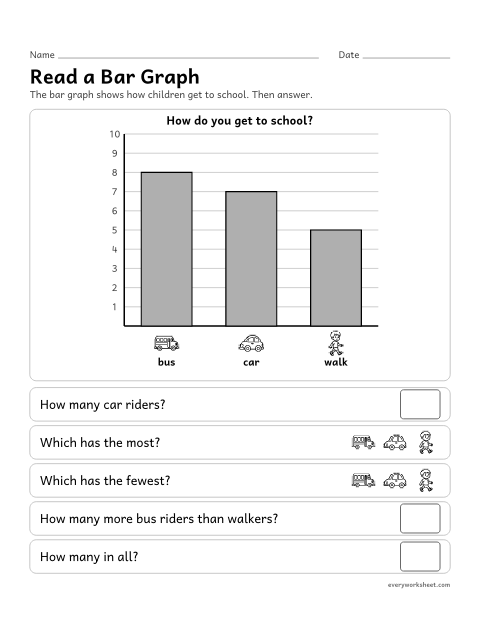
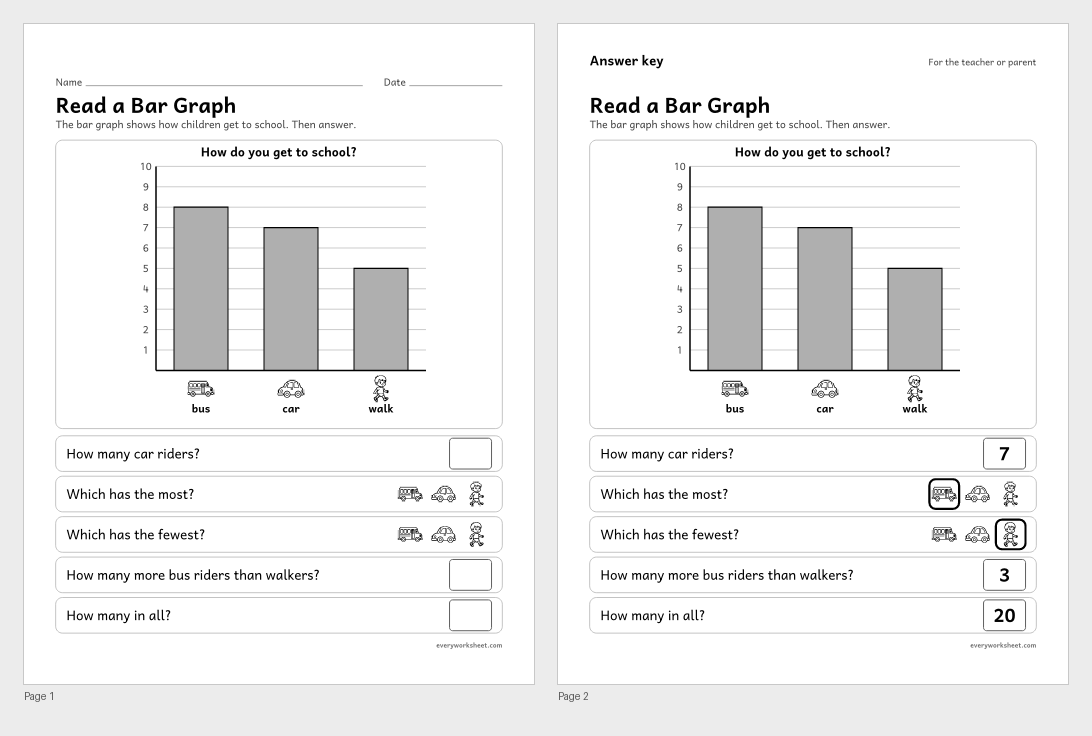
Reading a bar graph with three categories
Answer key on page 2
2 pages292 KB
 View all 2 pages
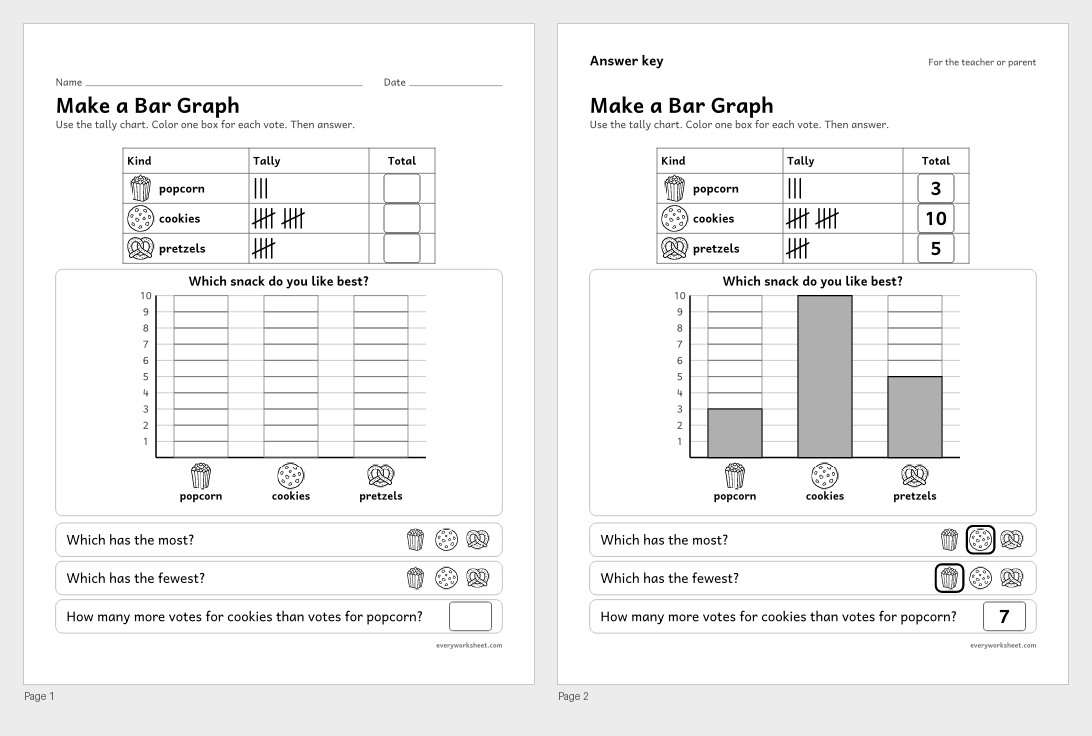
Making a bar graph from a tally chart
Answer key on page 2
2 pages616 KB
 View all 2 pages
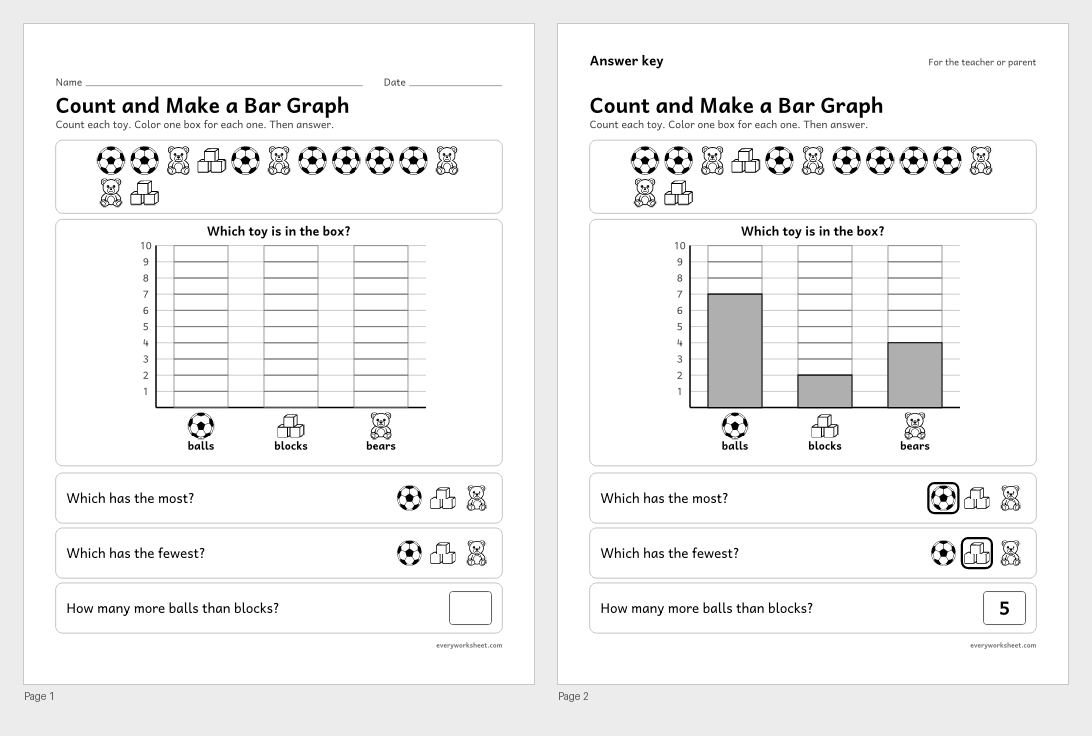
Counting pictures and showing them on a bar graph
Answer key on page 2
2 pages327 KB
 View all 2 pages
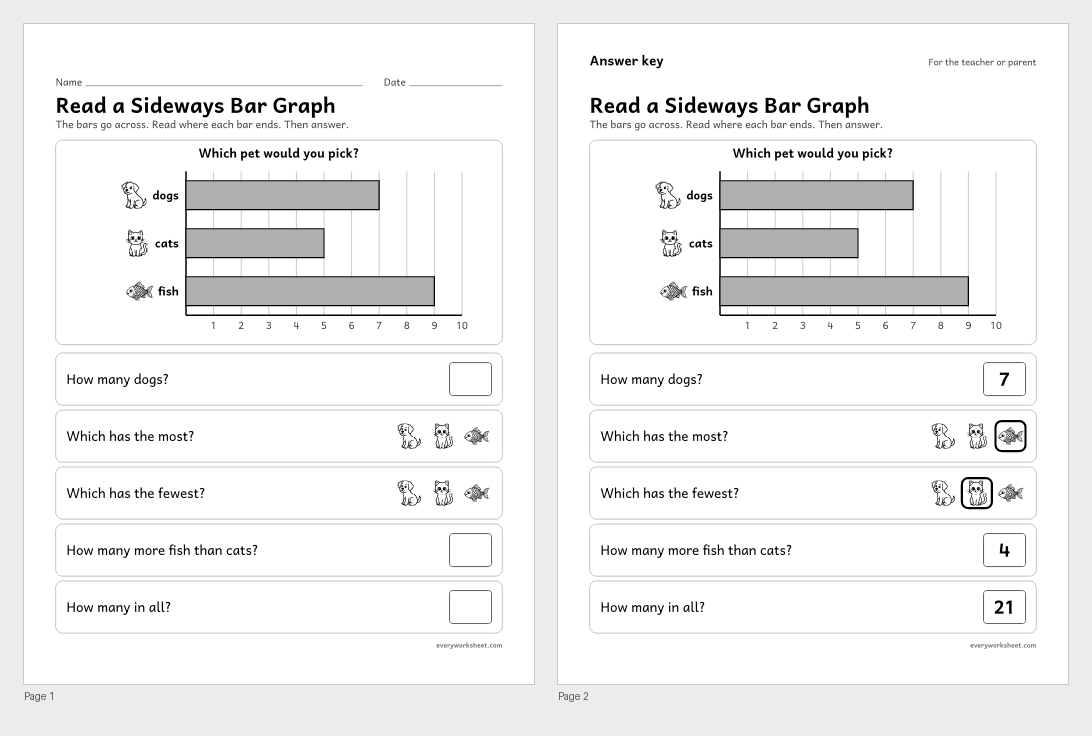
Reading a horizontal bar graph: how many, how many more and how many in all
Answer key on page 2
2 pages365 KB
 View larger
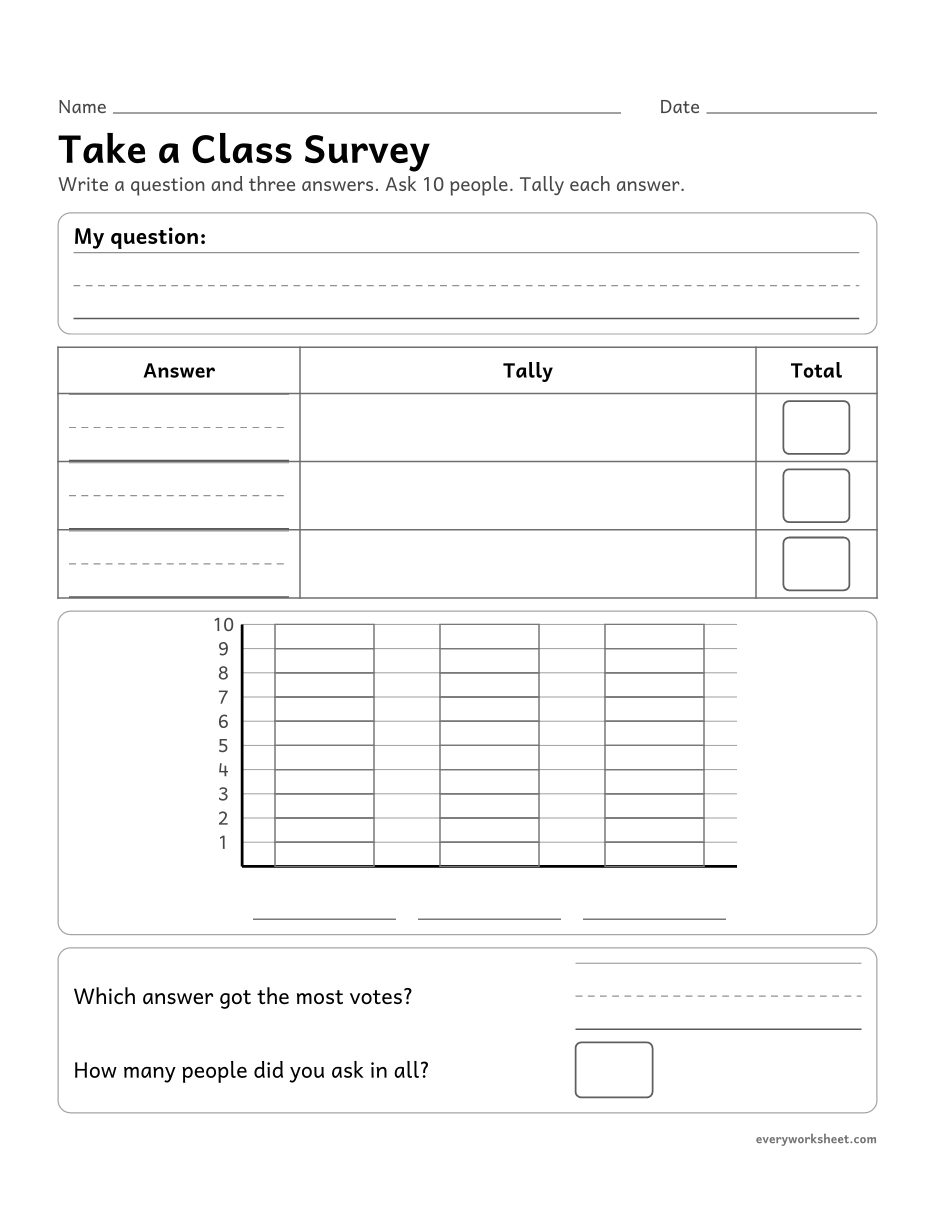
Asking a question, tallying the answers and graphing them
1 page31 KB
Print at 100% (actual size) for the cleanest tracing lines.
First graders sort data into up to three groups, show it in a chart or graph, and answer questions about it: how many in each group, how many in all, and how many more or fewer one group has than another.
The pages start with tally marks in groups of five, then move through the three kinds of graphs children meet first. They read a tally chart, then count pictures to make one. They read a picture graph, then build one from a tally chart. They read bar graphs going up and going across, then color in their own. Each graph has a short set of questions with the same five kinds of question every time, so children learn what to look for.
Every graph uses three groups with different totals, so there is always one clear most and one clear fewest. The pictures are simple line art: fruit, pets, bugs, weather, toys and ways to get to school. "Take a Class Survey" lets children ask their own question and graph the answers.
CCSS.MATH.CONTENT.1.MD.C.4Organize, represent, and interpret data with up to three categories; ask and answer questions about the total number of data points, how many in each category, and how many more or less are in one category than in another.Tally charts, picture graphs and bar graphs with up to three groups. Children make them and answer questions about how many in each group, how many in all, and how many more or fewer.
Each mark is one. After four marks, the fifth goes across them to make a group of five, so big counts are easy to read by 5s.
A picture graph shows one picture for each thing counted. A bar graph shows each group as a bar, and the number at the top of the bar tells how many.
Yes. Every page with right answers has an answer key on page 2, with the finished graph and every answer. The class survey uses your own data, so it has no key.